Tutorial 2: Reports
This tutorial builds on Tutorial 1 by adding output reports, downloading the results, and
plotting the data. It introduces add_reporters(), idmtools analyzers, and the emodpy-malaria
plotting utilities.
File: tutorials/tutorial_2_reports.py
Adding reports
A new add_reporters() function configures the reports to add to the simulation task. Reports
are added after EMODTask is created and before the experiment runs.
Three reports are enabled:
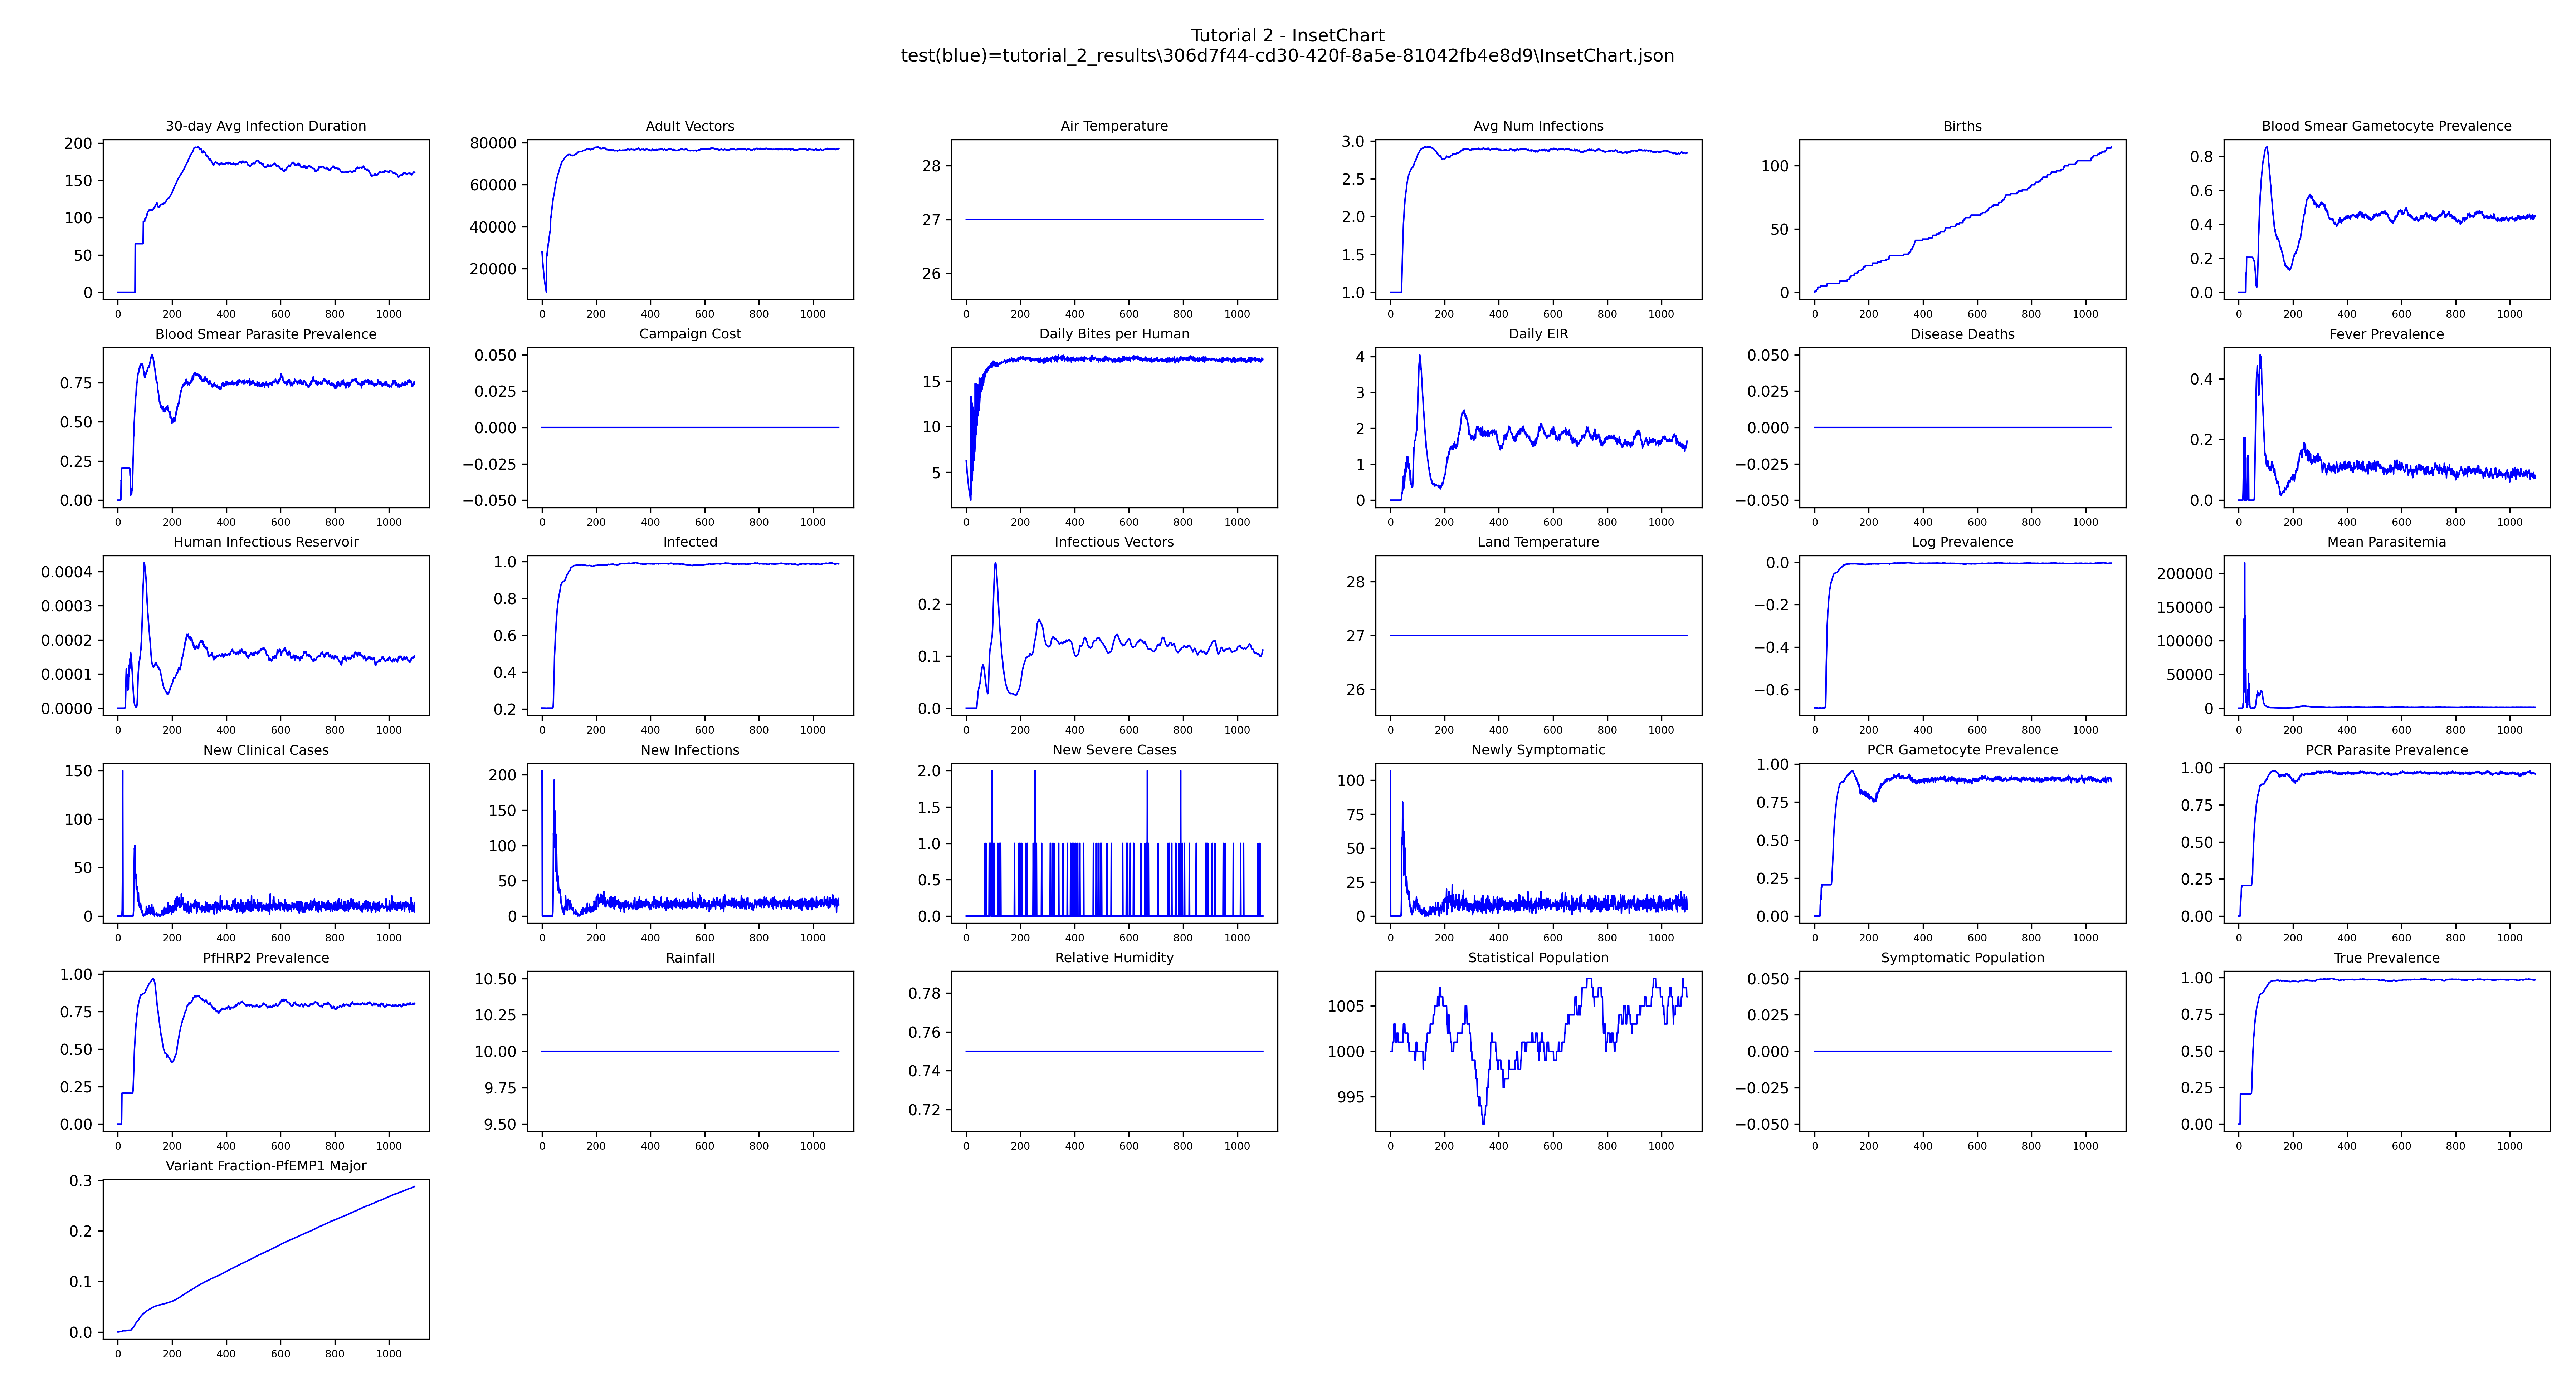
- InsetChart (
Enable_Default_Reporting = 1) — EMOD's built-in time-series summary. Channels include fraction infected, daily EIR, new clinical cases, and many others. - DemographicsSummary (
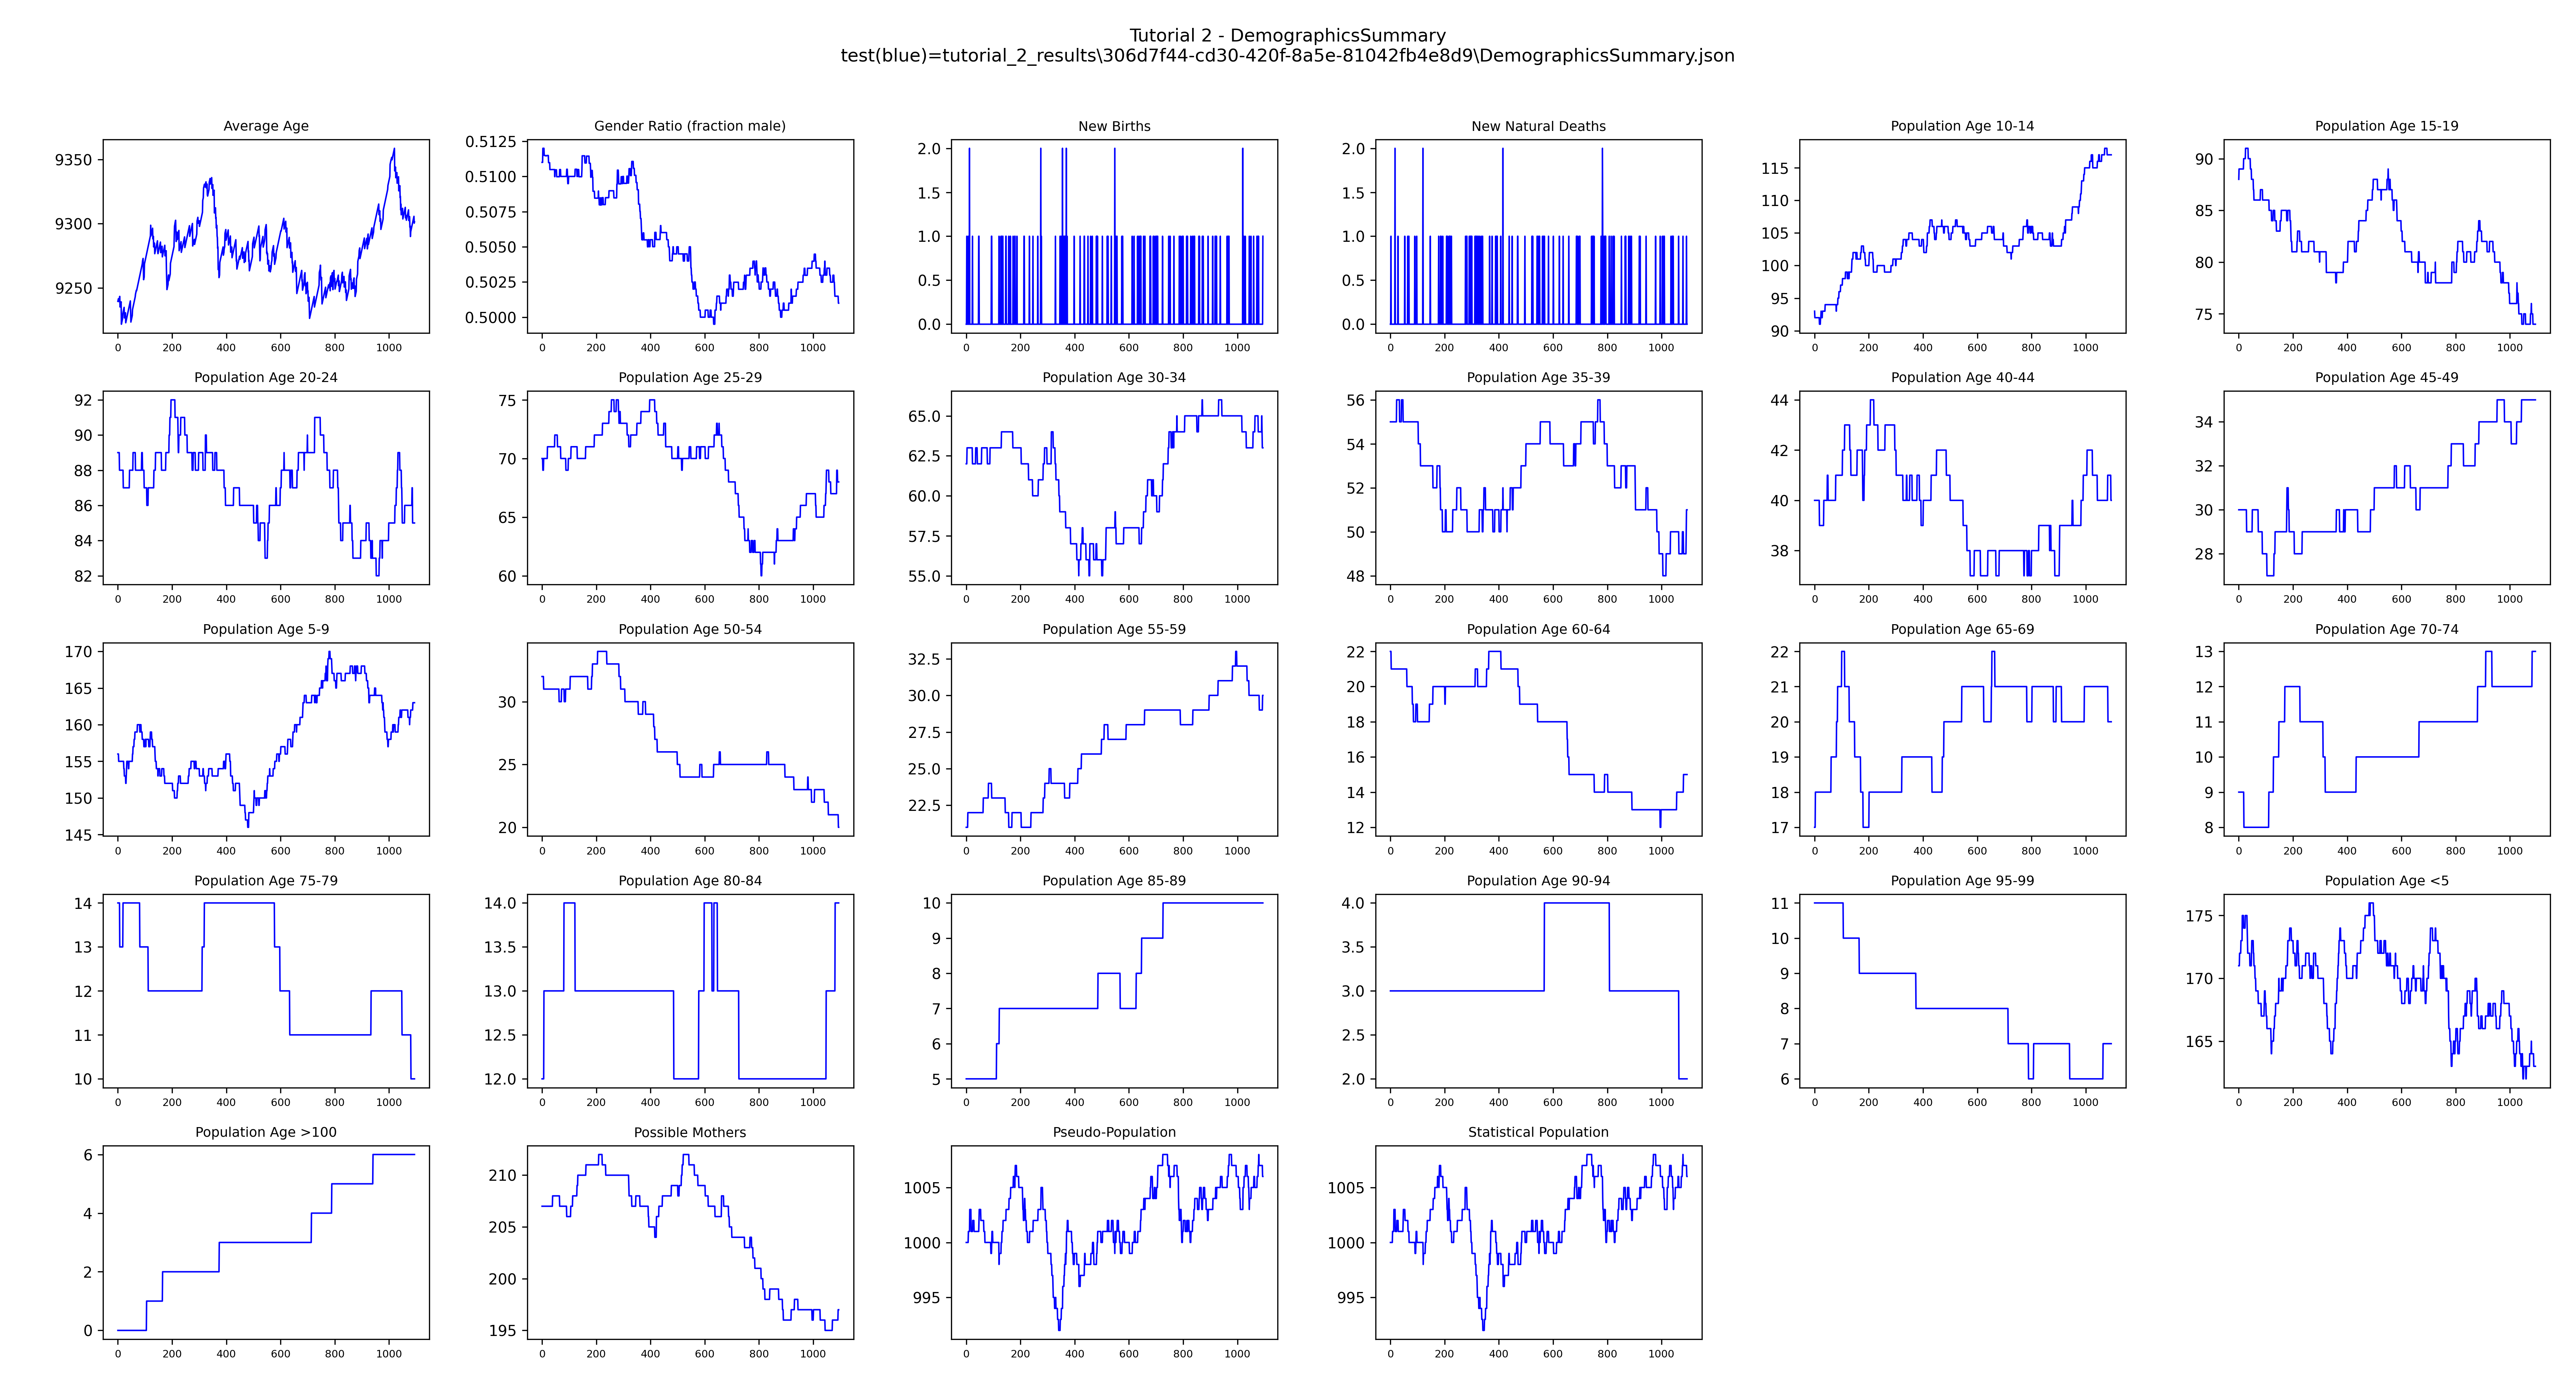
Enable_Demographics_Reporting = 1) — population and vital dynamics over time.set_team_defaults()disables this by default, so it is re-enabled here. - MalariaSummaryReport — age-stratified malaria metrics (PfPR, clinical incidence,
population) grouped by reporting interval and age bin. The
filename_suffixproducesMalariaSummaryReport_monthly.json.
add_reporters() is called after EMODTask is created in run_experiment():
Downloading results
After the experiment completes, DownloadAnalyzer copies specific output files from each
simulation into a local directory. This works the same way regardless of platform — Container,
COMPS, or SLURM.
The download only runs when experiment.succeeded is true. After it completes,
tutorial_2_results/ contains one subdirectory per simulation, named by its unique ID:
tutorial_2_results/
  551dfe56-f2f8-4831-9f15-b7c0ac529557/
    InsetChart.json
    DemographicsSummary.json
    MalariaSummaryReport_monthly.json
Plotting results
plot_inset_chart() reads all InsetChart.json files found under output_path and overlays
them on the same axes — one line per simulation — giving a quick overview of every channel over
time.
DemographicsSummary.json has the same channel report format as InsetChart.json and can be
plotted the same way. get_filenames() locates the downloaded files by prefix:
The resulting images are saved to tutorial_2_results/.
Example output
Next
Tutorial 3 adds a campaign file with treatment-seeking care and ITNs, and compares scenarios with and without interventions.