Plot simulation output
emodpy-malaria includes several scripts for plotting simulation output directly from the command line.
Each script accepts a file or directory of output files and produces one or more plots, either
displayed interactively or saved to an output directory. Run any script with --help to see the
full list of options.
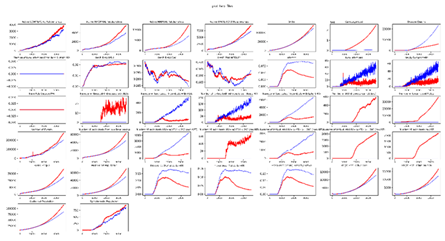
plot_inset_chart
Plots all channels from one or more InsetChart.json files as a grid of subplots. Up to three comparison files can be overlaid against a reference.
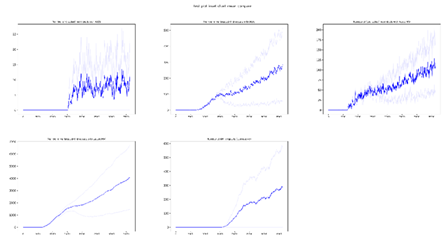
plot_inset_chart_mean_compare
Compares the mean of InsetChart.json files of up to three directories. Each directory can contain multiple InsetChart.json files from individual runs, like an experiment directory; the script calculates and plots the mean for each directory, allowing you to compare results between different scenarios or parameter sets.
Additional plotting utilities
Additional Python utilities are available for more advanced use, including converting channel reports to DataFrames, generic x/y plotting, and file discovery across experiment directories. See the API reference for full details.