Full Parasite Genetics (FPG) model
FPG extends the standard MALARIA_SIM model to track individual P. falciparum parasite genomes through the complete lifecycle — from the founding infections that seed a simulation, through replication within human hosts, across the mosquito transmission stages, and back into humans via infectious bites.
FPG tracks four core processes:
-
Within-host strain tracking: Each infection carries an explicit genome. A single infectious bite can deliver sporozoites carrying different genomes; each sporozoite that survives the bite and reaches the liver initiates a new infection — progressing independently through hepatocyte, asexual blood-stage, and gametocyte stages. A person can therefore acquire multiple simultaneous infections from a single bite, each with a distinct genome advancing on its own timeline.
-
Gametocyte and sporozoite sampling: When a mosquito takes a blood meal from an infected human, gametocytes are sampled from the person's active infections, giving the strains present in the human the opportunity to contribute to oocyst formation. Similarly, when an infectious mosquito bites a human, sporozoites are sampled from the mosquito, giving the strains present in the mosquito the opportunity to establish new infections in the human host.
-
Meiotic recombination: When a mosquito ingests gametocytes from genetically distinct strains, recombination occurs during oocyst development, producing progeny genomes that are new combinations of the parental alleles.
-
Allele roots: Every allele in the simulation carries a record of the ancestral infection from which it descended. This enables distinction between identity-by-descent (IBD) — alleles inherited from a common ancestor — and identity-by-state (IBS) — alleles that are identical but of independent origin.
Genome representation
FPG models the P. falciparum genome as 14 chromosomes spanning 22,790,000 base pairs in total, following the reference assembly of Gardner et al. (2002). Because genome length estimates vary across sources, positions in the model should be understood as coordinates in this specific reference assembly rather than as universal genomic positions. FPG represents each parasite genome as two parallel arrays, each with one entry per tracked SNP position:
-
Nucleotide sequence: An integer array of allele values, where each value (0–3) corresponds to one of the four nucleotide bases (A=0, C=1, G=2, T=3) at a tracked genome position.
-
Allele roots: A parallel integer array recording, for each position, the ID of the user-seeded infection — created via
OutbreakIndividualMalariaGenetics— from which this allele originally descended. As alleles propagate through transmission and recombination, each carries its origin ID forward unchanged, enabling downstream analysis to distinguish identity-by-descent (IBD, alleles tracing to a common user-seeded infection) from identity-by-state (IBS, alleles with the same value but independent origins).
Users specify which genome positions to track by supplying lists of base-pair coordinates in the configuration file (see the configuration section). Positions can be designated as barcode loci, drug resistance loci, or HRP loci. The total number of tracked positions directly affects simulation memory usage and runtime — simulations tracking more positions will require more memory and take longer to run.
For example, consider a simulation with 7 barcode positions, 2 drug resistance positions, and 1 HRP position — 10 tracked positions in total, spanning chromosomes 1, 2, and 3. Each genome is represented by two arrays of length 10. The example below shows a recombinant progeny genome derived from two ancestral infections: infection ID 5 (whose allele roots are all 5 at every position) and infection ID 6 (whose allele roots are all 6 at every position). The root switch within chromosome 1 — from 5 to 6 between positions 300 and 500 — is unambiguous evidence of a crossover in that interval. The chromosome 2 positions all carry root 5 and the chromosome 3 positions all carry root 6, reflecting the ancestral origin at each tracked position; however, uniform roots within a chromosome cannot distinguish independent assortment from a crossover that occurred outside the tracked region.
Barcode_Genome_Locations        = [100, 300, 500, 700000, 900000, 1700000, 2000000]
Drug_Resistant_Genome_Locations = [200, 800000]
HRP_Genome_Locations            = [600]

Genome = {
    "Nucleotide_Sequence": [0, 1, 2, 3, 0, 2, 3, 0, 1, 2],
    "Allele_Roots":        [5, 5, 5, 6, 6, 5, 5, 5, 6, 6]
}

locations  = [    100,        200,    300,    500, 600, 700000,     800000, 900000, 1700000, 2000000]
chromosome = [   chr1,       chr1,   chr1,   chr1,chr1,   chr2,       chr2,   chr2,    chr3,    chr3]
type       = [barcode, resistance, barcode, barcode, HRP, barcode, resistance, barcode, barcode, barcode]
sequence   = [      0,          1,       2,       3,   0,       2,          3,       0,       1,       2]
character  = [      A,          C,       G,       T,   A,       G,          T,       A,       C,       G]
roots      = [      5,          5,       5,       6,   6,       5,          5,       5,       6,       6]
#                                        ^crossover^   ^chr2: all root 5^           ^chr3: all root 6^
Within-host model
FPG builds on the existing EMOD malaria within-host model, which is described in Infection and immunity. Each infection progresses through hepatocyte, asexual, and gametocyte stages on its own timeline. Because each sporozoite that successfully reaches the liver initiates a separate infection, a multiply-infected person carries multiple parasite populations advancing independently — a behavior inherited from the base EMOD model, not specific to FPG.
For example, on day 1, a person gets an infectious bite from a mosquito that has half the sporozoites with barcode AATT and half with TTAA. This will create two infections. If the person gets another infectious bite on day 20 from a mosquito that only has sporozoites with AATT, the person will get a third infection with AATT. This new infection begins its own independent progression on day 20 — even though a day-1 AATT infection may still be active — because each infection is tracked separately regardless of genome identity.
FPG adds the ability to configure how PfEMP1 major epitope antigens are assigned to each infection
via Var_Gene_Randomness_Type. In the standard malaria model, PfEMP1 variants are assigned
randomly. FPG adds the option to have PfEMP1 variants determined by the parasite genome through
recombination, so that infections sharing alleles at PfEMP1 loci are more likely to express similar
antigens. However, the degree of association between barcode IBD and antigen similarity depends on
the physical proximity of PfEMP1_Variants_Genome_Locations to the barcode loci — if PfEMP1
locations are placed far from barcode loci, recombination may decouple them. In all modes, minor
epitopes remain randomly assigned. Note that the genome-determined PfEMP1 feature (FIXED_NEIGHBORHOOD) requires validation before
being applied to simulations used for policy decisions.
Note
The Max_Individual_Infections parameter in config.json caps the number of concurrent
infections a person can carry. When a person is already at the cap and receives a new
infectious bite, the sporozoites that would establish new infections are discarded. The 2018
EMOD calibration set this to 3, which was appropriate for epidemiological modeling and
reflected a real performance constraint at the time — larger infection counts made EMOD
substantially slower. Subsequent performance improvements have largely eliminated that
constraint. For FPG simulations, a value of 3 artificially suppresses genetic diversity: it
limits the number of distinct genomes that can co-circulate within a host and be transmitted
together to a mosquito, reducing the opportunities for recombination and underrepresenting
the true complexity of infection seen in high-transmission settings. FPG simulations should
use a value closer to 20.
Transmission
FPG replaces EMOD's contagion-pool transmission model (in which infectiousness is aggregated across all infected individuals and applied probabilistically across the population) with one-to-one transmission that links specific source humans to specific mosquitoes and specific recipient humans, preserving genome identity at each step.
Human-to-vector
When an infectious mosquito takes a blood meal from an infected human, gametocytes are sampled from the person's active infections proportionally to each infection's gametocyte density, using a multinomial draw. The number of gametocytes in the blood meal is proportional to the person's total gametocyte density, scaled by the fraction of blood taken during feeding, with a minimum of two (one male, one female) required to form an oocyst. The exact count is not the critical quantity — what matters is that the relative density across infections determines each strain's probability of contributing gametocytes to the blood meal. The number of oocysts formed is then drawn independently from a negative binomial distribution — the oocyst count is not determined by the number of gametocytes sampled. Male and female gametocytes are then paired for each oocyst using a multivariate hypergeometric draw without replacement; if either sex is absent from the blood meal, no oocysts form.
Once formed, oocysts develop over a temperature-dependent period governed by an Arrhenius relationship — the same process that determines the extrinsic incubation period (EIP) in the base EMOD model; see Vector transmission for the governing parameters. Each oocyst produces a cohort of sporozoites sharing the same recombinant genome (see the meiotic-recombination section). Sporozoites accumulate in the mosquito's salivary glands and decay over time at a configurable rate. If all sporozoites die before the mosquito acquires new infections, the mosquito reverts to an uninfected state — unlike the base EMOD model, where a vector remains infectious once it reaches that state.
If an infected or infectious mosquito bites another infected human, she can acquire new gametocytes, form new oocysts, and produce additional sporozoite cohorts alongside any already present. As with infections in the human host, gametocytes ingested from different bites develop on independent timelines. The resulting sporozoite cohorts may carry genomes derived from different human hosts, introducing additional genetic diversity into the mosquito's sporozoite pool.
Vector-to-human
A person may receive infectious bites from multiple mosquitoes within a single time step; sporozoites from all bites are accumulated and processed together.
When an infectious mosquito bites a susceptible human, the number of sporozoites transmitted is drawn from a negative binomial distribution. Sporozoites are allocated across the mosquito's salivary gland cohorts proportionally to each cohort's density using a multinomial draw, so genomes that are more abundant are more likely to be transmitted.
For each genome cohort delivered, a Poisson draw determines how many sporozoites successfully infect
hepatocytes — with mean equal to the cohort size multiplied by Base_Sporozoite_Survival_Fraction
(see Parasite configuration). If at least one succeeds, a new infection is
established with that count as its initial hepatocyte load, progressing independently through the
incubation period before transitioning to the asexual blood stage.
All numerical parameters in the transmission model — including sporozoites per bite and hepatocyte survival fraction — are derived from empirical literature and are configurable; see the configuration section for details.
Meiotic recombination
Meiotic recombination occurs during oocyst development when a mosquito has ingested gametocytes of genetically distinct strains. FPG implements the obligate chiasma framework of Wong et al. (2018), calibrated against laboratory crosses of P. falciparum.
When the male and female parental genomes of an oocyst are identical, recombination is skipped and the four progeny genomes are clones of the parent. When the parents are genetically distinct, meiosis proceeds as follows.
Crossover placement: On each of the 14 chromosomes, one obligate crossover is placed at a uniformly random position along the chromosome. Each crossover always occurs between one maternal and one paternal chromatid — never between two chromatids of the same parent. The specific chromatid pair involved in each crossover is selected randomly. Additional secondary crossovers are placed bidirectionally outward from the obligate position, with inter-crossover distances drawn from a gamma distribution (shape k=2, scale θ=0.38 cM, mean 0.76 cM). Centimorgan distances are converted to base pairs at a rate of approximately 1,500 kilobases per cM, yielding a mean inter-crossover distance of roughly 1.14 Mb. Because chromosomes vary in length (0.6–3.3 Mb), shorter chromosomes typically receive only the obligate crossover while longer ones receive one to three secondary crossovers.
Progeny assembly: All crossover positions are fixed in the original genomic coordinate space before any exchanges occur. Each crossover exchanges the tail of the two participating chromatids at their current state; subsequent crossover positions are not recalculated based on prior exchanges. At each crossover point, allele values and allele roots are exchanged between the participating chromatids. Each of the four progeny genomes then receives exactly one chromatid from each of the 14 chromosome tetrads, with the chromatid-to-progeny assignment randomized independently per chromosome (independent assortment). Sporozoites are distributed equally among the four progeny genotypes, so each sibling genotype represents approximately one-quarter of the oocyst's sporozoites. A single outcrossed oocyst therefore contributes four distinct recombinant genotypes to the vector's sporozoite pool.
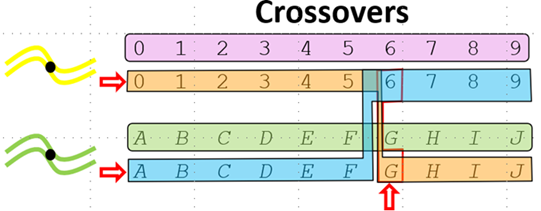
The figure below illustrates a single crossover between two parental chromatids. Parent 1 (top) carries alleles 0–9 at positions 0–9; Parent 2 (bottom) carries alleles A–J at the same positions. A crossover occurs between positions 5 and 6 (indicated by the arrow). The exchange produces two recombinant chromatids: one carrying Parent 1's alleles (0–5) to the left of the crossover and Parent 2's alleles (G–J) to the right, and the complementary recombinant carrying Parent 2's alleles (A–F) on the left and Parent 1's alleles (6–9) on the right. The highlighted segments show the portions exchanged between the two chromatids at the crossover point.
Seeding infections
OutbreakIndividualMalariaGenetics is the FPG counterpart to EMOD's standard
OutbreakIndividual intervention. Rather than arising through transmission, it directly introduces
infections with user-specified parasite genomes into targeted individuals. All human infections in
EMOD have a unique infection ID. What makes an infection created by
OutbreakIndividualMalariaGenetics an ancestral infection is that the allele root at every
genome position is set to that infection's own ID — rather than being inherited from a parent genome.
This establishes the infection as the root of a lineage, enabling identity-by-descent (IBD) tracking
of all descendant alleles as they propagate through the simulation.
The genome for each seeded infection is specified via Create_Nucleotide_Sequence_From, which
selects one of three modes:
-
BARCODE_STRING (default): Specify the genome using
Barcode_String, with optionalDrug_Resistant_StringandHRP_String. Every infection seeded by this outbreak instance receives the same genome. To introduce multiple distinct genotypes, use multipleOutbreakIndividualMalariaGeneticsevents with different strings. -
NUCLEOTIDE_SEQUENCE: Specify the complete genome, including the barcode (
Barcode_String), drug resistance loci (Drug_Resistant_String), HRP loci (HRP_String), MSP variant (MSP_Variant_Value), and PfEMP1 major epitope values (PfEMP1_Variants_Values). -
ALLELE_FREQUENCIES: Each infection's genome is drawn independently from per-position allele frequencies (
Barcode_Allele_Frequencies_Per_Genome_Location,Drug_Resistant_Allele_Frequencies_Per_Genome_Location,HRP_Allele_Frequencies_Per_Genome_Location). This mode is useful for seeding a genetically diverse founding population without specifying every individual genome. However, the actual diversity in the initial population is limited by the number of ancestral infections introduced — seeding only a small number of infections will produce limited genetic variation regardless of the allele frequencies specified. Users should consider how the combination of allele frequencies and number of seeded infections will shape the genetic diversity of the founding population.
OutbreakIndividualMalariaGenetics can only be used when Malaria_Model is set to
MALARIA_MECHANISTIC_MODEL_WITH_PARASITE_GENETICS; using the standard OutbreakIndividual in
that mode will raise a configuration error.
Drug resistance
FPG models drug resistance by modifying drug killing effects based on the parasite's genome. When EMOD computes the drug kill rate for an infection, it passes the parasite's genome to the drug model, which checks whether specific alleles are present at designated positions. If the genome matches, one or more modifiers are applied to the drug's efficacy parameters. This allows users to model parasites that are more or less susceptible to a given drug based on their genetic makeup.
Drug killing is modeled across five parasite life stages: hepatocytes, infected red blood cells (IRBCs), gametocyte stages 0–2, gametocyte stages 3–4, and mature gametocytes. For each stage, the drug has a parameter that converts concentration-derived efficacy into a killing rate. Resistance modifiers scale these parameters for parasites carrying specific alleles.
Configuring resistance in the drugs
Genome positions used for drug resistance tracking are specified in
Parasite_Genetics.Drug_Resistant_Genome_Locations in config.json (see the
configuration section). Resistance behavior for each drug is then configured in
Malaria_Drug_Params by adding a Resistances array to the drug entry. Each element of the
array is a resistance object with the following parameters:
| Parameter | Data type | Default | Description |
|---|---|---|---|
Drug_Resistant_String |
string | — | A string of nucleotide characters (A, C, G, T, or * for wildcard) — one per position in Drug_Resistant_Genome_Locations. The modifier is applied only if the parasite's genome matches all non-wildcard positions in this string. |
PKPD_C50_Modifier |
float | 1.0 | Multiplied times Drug_PKPD_C50 when the string matches. Values above 1.0 reduce drug potency; values below 1.0 increase it. |
Max_IRBC_Kill_Modifier |
float | 1.0 | Multiplied times Max_Drug_IRBC_Kill when the string matches. |
If a parasite's genome matches multiple resistance objects, the modifiers from each matching object
are multiplied together. The following example configures Artemether with two resistance objects,
assuming Drug_Resistant_Genome_Locations has two positions. A T at the first position
reduces IRBC killing to 5% of baseline; an A at the second position independently increases
potency by reducing Drug_PKPD_C50 and reduces IRBC killing via Max_Drug_IRBC_Kill.
The * wildcard means that position is ignored for matching:
{
    "Malaria_Drug_Params": [
        {
            "Name": "Artemether",
            "PKPD_Model": "CONCENTRATION_VERSUS_TIME",
            "Bodyweight_Exponent": 1.0,
            "Drug_Cmax": 114.0,
            "Drug_Decay_T1": 0.12,
            "Drug_Decay_T2": 0.12,
            "Drug_Dose_Interval": 0.5,
            "Drug_Fulltreatment_Doses": 6.0,
            "Drug_Gametocyte02_Killrate": 2.5,
            "Drug_Gametocyte34_Killrate": 1.5,
            "Drug_GametocyteM_Killrate": 0.7,
            "Drug_Hepatocyte_Killrate": 0,
            "Drug_PKPD_C50": 0.6,
            "Drug_Vd": 1.0,
            "Max_Drug_IRBC_Kill": 8.9,
            "Fractional_Dose_By_Upper_Age": [
                {"Fraction_Of_Adult_Dose": 0.25, "Upper_Age_In_Years": 3.0},
                {"Fraction_Of_Adult_Dose": 0.5,  "Upper_Age_In_Years": 6.0},
                {"Fraction_Of_Adult_Dose": 0.75, "Upper_Age_In_Years": 10.0}
            ],
            "Resistances": [
                {
                    "Drug_Resistant_String": "T*",
                    "PKPD_C50_Modifier": 1.0,
                    "Max_IRBC_Kill_Modifier": 0.05
                },
                {
                    "Drug_Resistant_String": "*A",
                    "PKPD_C50_Modifier": 0.44,
                    "Max_IRBC_Kill_Modifier": 0.77
                }
            ]
        }
    ]
}
Note
The drug efficacy model checks specific allele patterns defined in each drug's Resistances
array. The InsetChart drug resistance channels use a simpler criterion: any infection with a
non-A allele at any position in Drug_Resistant_Genome_Locations is counted as resistant,
regardless of which drug or which specific allele pattern triggered resistance.
Seeding resistance
Drug resistant strains are introduced into the simulation using
OutbreakIndividualMalariaGenetics with Drug_Resistant_String (for BARCODE_STRING and
NUCLEOTIDE_SEQUENCE modes) or Drug_Resistant_Allele_Frequencies_Per_Genome_Location (for
ALLELE_FREQUENCIES mode). See the seeding-infections section for details. Once
introduced, resistance alleles propagate and recombine through the simulation like any other
genome position.
HRP2/3 deletion
Plasmodium falciparum secretes histidine-rich proteins HRP2 and HRP3 into the bloodstream. Most rapid diagnostic tests (RDTs) target HRP2 as a marker of active infection. Parasites carrying deletions of the pfhrp2 and/or pfhrp3 genes produce no HRP2 protein and test false-negative on HRP2-based RDTs despite active infection.
FPG tracks HRP gene status as allele values at positions designated by HRP_Genome_Locations in
Parasite_Genetics. Each position represents one HRP locus:
- An allele of
Aindicates the HRP gene at that position is present (functional) — the infection produces HRP2 protein. - Any other allele (
C,G, orT) indicates the HRP gene is deleted at that position.
An infection is classified as "HRP-deleted" only when all designated HRP positions carry a
non-A allele. If any position retains A, the infection is treated as HRP-expressing. This
allows independent representation of pfhrp2 and pfhrp3: defining two HRP positions (one per
gene) means an infection with pfhrp2 deleted but pfhrp3 intact still produces HRP2 protein,
reflecting the cross-reactivity of pfhrp3 with HRP2-targeting RDTs.
HRP2 protein dynamics
Each time step, the host's circulating HRP2 level is updated from the IRBCs of HRP-expressing infections only. HRP-deleted infections contribute zero IRBCs to this sum. The dynamics follow Marquart et al. (2012):
where \([\text{HRP2}]\) is the circulating HRP2 protein level (pg), \(\text{IRBC}_{HRP}\)
is the total number of infected red blood cells from HRP-expressing infections, \(B\) is
PfHRP2_Boost_Rate (pg per iRBC per day), and \(D\) is PfHRP2_Decay_Rate (per day). The
decay term is approximated as linear within each time step. These parameters are configurable; see
the configuration section.
Interventions and diagnostics using the PF_HRP2 measurement type compare the accumulated HRP2
level against the Report_Detection_Threshold_PfHRP2 threshold.
Seeding HRP deletions
HRP status is set when ancestral infections are seeded via OutbreakIndividualMalariaGenetics.
In BARCODE_STRING or NUCLEOTIDE_SEQUENCE mode, the HRP_String parameter assigns a fixed
HRP genotype to every seeded infection — one character per position in HRP_Genome_Locations.
For example, with two HRP positions representing pfhrp2 and pfhrp3:
"AA"— both genes intact; infection is fully HRP-expressing."CA"— pfhrp2 deleted, pfhrp3 intact; infection still produces HRP2 protein."CT"— both genes deleted; infection is fully HRP-deleted.
In ALLELE_FREQUENCIES mode, use HRP_Allele_Frequencies_Per_Genome_Location to seed a
mixture of HRP genotypes across the population. See the seeding-infections section for
details.
Configuration
Seealso
set_parasite_genetics_params sets up default values for all FPG configuration parameters. Most users should start with this function and adjust individual parameters as needed. The parameter descriptions in this section serve as a reference for understanding and modifying those values.
FPG is enabled by setting Malaria_Model to
MALARIA_MECHANISTIC_MODEL_WITH_PARASITE_GENETICS in config.json. All FPG-specific parameters
are nested under the Parasite_Genetics key in config.json.
Genome position parameters
The most fundamental configuration choices are which genomic positions to track. Positions are integer base-pair coordinates in the linearized P. falciparum genome — chromosomes 1 through 14 concatenated end to end into a single coordinate space of 22,790,000 bp. The table below lists the length and position range of each chromosome.
| Chromosome | Length (bp) | Position range |
|---|---|---|
| 1 | 643,000 | 1 – 643,000 |
| 2 | 947,000 | 643,001 – 1,590,000 |
| 3 | 1,100,000 | 1,590,001 – 2,690,000 |
| 4 | 1,200,000 | 2,690,001 – 3,890,000 |
| 5 | 1,300,000 | 3,890,001 – 5,190,000 |
| 6 | 1,400,000 | 5,190,001 – 6,590,000 |
| 7 | 1,400,000 | 6,590,001 – 7,990,000 |
| 8 | 1,300,000 | 7,990,001 – 9,290,000 |
| 9 | 1,500,000 | 9,290,001 – 10,790,000 |
| 10 | 1,700,000 | 10,790,001 – 12,490,000 |
| 11 | 2,000,000 | 12,490,001 – 14,490,000 |
| 12 | 2,300,000 | 14,490,001 – 16,790,000 |
| 13 | 2,700,000 | 16,790,001 – 19,490,000 |
| 14 | 3,300,000 | 19,490,001 – 22,790,000 |
Positions are assigned to one of the following functional categories. No two parameters may share a position, and positions within a single parameter must be in ascending order.
| Parameter | Data type | Description |
|---|---|---|
Barcode_Genome_Locations |
list of integers | Genome positions of barcode SNP loci. The number of positions determines the required length of Barcode_String in OutbreakIndividualMalariaGenetics and in report filters. Can be empty if no barcode positions are tracked. |
Drug_Resistant_Genome_Locations |
list of integers | Genome positions of drug resistance loci. These locations and their allele values can be referenced in Malaria_Drug_Params.Resistances to modify drug efficacy based on parasite genotype. |
HRP_Genome_Locations |
list of integers | Genome positions of HRP (histidine-rich protein) loci. An allele value of A at a position indicates the HRP gene is present (functional); any other value (C, G, T) indicates the gene is deleted at that position. An infection is HRP-deleted only when all positions carry a non-A allele. See the HRP2/3 Deletion section for details. |
MSP_Genome_Location |
integer | Genome position of the MSP locus. Only used when Var_Gene_Randomness_Type is FIXED_NEIGHBORHOOD or FIXED_MSP. |
PfEMP1_Variants_Genome_Locations |
list of integers | Genome positions of PfEMP1 major epitope loci. Must define exactly 50 locations corresponding to the 50 PfEMP1 variants in each clonal infection's repertoire (see Malaria infection and immune model). Only used when Var_Gene_Randomness_Type is FIXED_NEIGHBORHOOD. |
The total number of tracked positions — barcode + drug resistance + HRP (+ MSP and PfEMP1 if applicable) — directly affects simulation memory usage and runtime. More tracked positions require more memory and increase simulation time.
Antigen expression
| Parameter | Data type | Default | Description |
|---|---|---|---|
Var_Gene_Randomness_Type |
enum | ALL_RANDOM | Controls how MSP and PfEMP1 major epitope antigens are assigned to each new infection. ALL_RANDOM: MSP and PfEMP1 major epitope antigens are both randomly assigned for every infection, matching base model behavior. FIXED_MSP: MSP is genome-determined; PfEMP1 major epitopes remain random. FIXED_NEIGHBORHOOD: both MSP and PfEMP1 major epitopes are genome-determined. In all modes minor epitopes (the five nonspecific epitopes associated with each PfEMP1 variant; see Malaria infection and immune model) are always randomly assigned. |
Neighborhood_Size_MSP |
integer | 4 | When Var_Gene_Randomness_Type is FIXED_NEIGHBORHOOD or FIXED_MSP, the number of adjacent MSP variants from which the strain's MSP value is drawn. Must not exceed Falciparum_MSP_Variants. |
Neighborhood_Size_PfEMP1 |
integer | 10 | When Var_Gene_Randomness_Type is FIXED_NEIGHBORHOOD, the number of adjacent PfEMP1 variants from which each epitope value is drawn. Must not exceed Falciparum_PfEMP1_Variants. |
Transmission parameters
| Parameter | Data type | Default | Description |
|---|---|---|---|
Sporozoites_Per_Oocyst_Distribution |
enum | CONSTANT_DISTRIBUTION | Distribution type for the number of sporozoites produced per oocyst. Follows standard EMOD distribution configuration. |
Sporozoite_Life_Expectancy |
float | 10.0 | The number of days a sporozoite survives in the mosquito. The mortality rate is the inverse of this parameter. |
Num_Sporozoites_In_Bite_Fail |
float | 12.0 | Negative binomial parameter (number of failures) for sporozoites transmitted per infectious bite. |
Probability_Sporozoite_In_Bite_Fails |
float | 0.5 | Negative binomial parameter (probability of failure) for sporozoites transmitted per infectious bite. |
Num_Oocyst_From_Bite_Fail |
float | 3.0 | Negative binomial parameter (number of failures) for oocysts formed per human-to-vector bite. |
Probability_Oocyst_From_Bite_Fails |
float | 0.5 | Negative binomial parameter (probability of failure) for oocysts formed per human-to-vector bite. |
Recombination parameters
| Parameter | Data type | Default | Description |
|---|---|---|---|
Crossover_Gamma_K |
float | 2.0 | Shape parameter (k) of the gamma distribution for secondary inter-crossover distances during meiosis. The mean inter-crossover distance is k×θ cM and the variance is k×θ² cM². Output is in centimorgans converted internally to base pairs. |
Crossover_Gamma_Theta |
float | 0.38 | Scale parameter (θ) of the gamma distribution for secondary inter-crossover distances during meiosis. The mean inter-crossover distance is k×θ cM and the variance is k×θ² cM². |
HRP protein dynamics
| Parameter | Data type | Default | Description |
|---|---|---|---|
PfHRP2_Boost_Rate |
float | 0.07 | Rate at which HRP2 protein accumulates from HRP-expressing IRBCs (pg per iRBC per day). |
PfHRP2_Decay_Rate |
float | 0.172 | Daily fractional decay of circulating HRP2 protein (corresponding to a half-life of approximately 3.67 days). |
Similarity to base model
| Parameter | Data type | Default | Description |
|---|---|---|---|
Enable_FPG_Similarity_To_Base |
boolean | false | If true, FPG simulates the base MALARIA_SIM model: a person can acquire only one new infection per time step, and a vector is always considered infected once it acquires an infection. Provided for validation — allows direct comparison of FPG and base model output. |
Output reports
FPG provides two dedicated output reports and enhances several existing reports with genetic data.
FPG-specific reports
ReportFPGOutputObservationalModel (ReportFpgOutputForObservationalModel) is
the primary report for FPG workflows. It samples the infected human population and generates three
output files: a CSV of infected individuals with their genome indices, and two numpy binary files
containing the nucleotide sequences and allele roots for each referenced genome. This report is
designed for use in full parasite genetics post-processing pipelines.
ReportFPGNewInfections (ReportFpgNewInfections) provides detailed data on
each new human infection as it occurs, including the genome of the infecting parasite. When
Report_Crossover_Data_Instead is set to true, it instead records the crossover locations that
produced each infection's genome, which is useful for validating recombination behavior.
Reports with FPG-enhanced output
ReportSQLMalariaGenetics (SqlReportMalariaGenetics) records barcode and full
nucleotide sequence data in two additional database tables — ParasiteGenomes and
GenomeSequenceData — alongside the standard epidemiological tables. A DrugStatus table
tracking drug name, current efficacy, and remaining doses for each person at each time step can be
enabled via Include_Drug_Status_Table.
ReportNodeDemographicsMalariaGenetics
(ReportNodeDemographicsMalariaGenetics) extends the standard malaria node demographics report by
adding per-barcode infection counts, stratified by node and time step. The Drug_Resistant_Strings
parameter adds columns counting infections with specific drug resistance allele patterns, including
wildcard (*) matching.
ReportVectorStatsMalariaGenetics (ReportVectorStatsMalariaGenetics) extends
the standard vector statistics report with genetic barcode data on the parasites carried in the
vector population, including details on oocysts and sporozoites.
InsetChart channels
When FPG is enabled, InsetChart.json includes the following additional channels beyond the standard malaria channels:
| Channel | Description |
|---|---|
| Avg Num Vector Infs | The average number of distinct oocyst and sporozoite cohorts currently present in infected vectors. |
| Complexity of Infection | The mean number of distinct parasite genomes per infected person (complexity of infection, COI). Distinct genomes are identified by barcode hashcode only — drug resistance, HRP, MSP, and PfEMP1 loci are not considered. |
| Drug Resistant Fraction of All Infections | The fraction of all active human infections that have a non-A allele at any position in Drug_Resistant_Genome_Locations. |
| Drug Resistant Fraction of Infected People | The fraction of currently infected people who have at least one infection with a non-A allele at any position in Drug_Resistant_Genome_Locations. |
| HRP Deleted Fraction of All Infections | The fraction of all active human infections that are HRP-deleted (all HRP loci carry a non-A allele). |
| HRP Deleted Fraction of Infected People | The fraction of currently infected people who have at least one HRP-deleted infection. |
| Infected and Infectious Vectors | The fraction of adult vectors that are infected (have acquired gametocytes but not yet produced sporozoites) or infectious (have sporozoites in salivary glands). |
| New Vector Infections | The number of vectors that acquired new infections from human blood meals during this time step. |
| Num Total Infections | The total count of active human infections across all individuals in the simulation. |
| PfHRP2 Prevalence | The fraction of the population that would test positive on an HRP2-based rapid diagnostic test, based on whether circulating HRP2 exceeds Report_Detection_Threshold_PfHRP2. |
FPG Observational Model
The FPGObservationalModel is a separate Python tool that converts the output of ReportFPGOutputObservationalModel into realistic genomic surveillance data. Rather than analyzing the full simulated population directly, it applies configurable sampling strategies that mirror how field surveillance data would actually be collected, then computes genetic metrics on the resulting sample.
The tool follows a three-step workflow:
- Hard filtering — restrict the infection pool by criteria such as symptomatic-only infections or monogenomic infections.
- Sampling — draw a sample from the filtered pool using random, seasonal, or age-directed sampling strategies.
- Metric computation — calculate genetic statistics on the sample.
Genetic metrics computed include complexity of infection (true and effective COI), co-transmission proportions, heterozygosity, identity-by-descent and identity-by-state (IBD/IBS) pairwise statistics, the relatedness coefficient (Rh) for polygenomic infections, within-host diversity (Fws), allele frequencies, and proportions of monogenomic and unique genomes.
The tool produces three output files: a sampled infections CSV with individual-level metrics, a model summaries CSV with population-level statistics aggregated by time period and subpopulation, and an IBx distributions JSON file with pairwise relatedness distributions.
An end-to-end example of running FPG with EMOD and invoking the FPGObservationalModel via
post-processing is provided in the emodpy-malaria repository at examples-container/fpg_example,
where it is called from the dtk_post_process.py script after the simulation completes.
References
-
Marquart L, Butterworth A, McCarthy JS, Gatton ML. "Modelling the dynamics of Plasmodium falciparum histidine-rich protein 2 in human malaria to better understand malaria rapid diagnostic test performance." Malaria Journal. 2012;11:74.
-
Gardner MJ, et al. "Genome sequence of the human malaria parasite Plasmodium falciparum." Nature. 2002;419:498–511.