Tutorial 3: Customize with build functions
This tutorial introduces custom build functions — the mechanism for modifying the baseline
country model. Instead of passing the Zambia model's functions directly to EMODTask, you
write your own that call the baseline first and then apply additional changes.
File: tutorials/tutorial_3_build_functions.py
What are build functions?
Build functions are the functions that EMODTask calls to construct the configuration files
for each simulation. There are four:
| Function | Purpose |
|---|---|
build_config(config) |
Sets simulation-wide configuration parameters |
build_campaign(campaign) |
Defines when and how interventions are distributed |
build_demographics() |
Sets up population, mortality, fertility, and relationship parameters |
build_reports(reporters) |
Configures which output reports to generate |
Each build function is called once per simulation. If your experiment has a sweep of 10 simulations, each build function runs 10 times.
Modifying configuration
This build_config calls the Zambia baseline first and then modifies two parameters —
doubling the initial population and reducing the simulation duration by 10 years:
def build_config(config):
    zambia = cm.ZambiaForTraining
    config = zambia.build_config(config)

    config.parameters.x_Base_Population = config.parameters.x_Base_Population * 2.0
    config.parameters.Simulation_Duration = config.parameters.Simulation_Duration - (10 * 365)

    return config
The larger population makes the simulation more statistically robust, while the shorter duration partially offsets the added runtime. Simulations may take 5–7 minutes.
Adding an intervention to the campaign
This build_campaign calls the Zambia baseline to build the standard care cascade and then
adds an annual mass distribution of a long-acting PrEP (LA-PrEP) intervention starting in 2025,
with coverage increasing each year. Using a Python for loop avoids duplicating the same
event configuration 15 times in JSON:
def build_campaign(campaign):
    zambia = cm.ZambiaForTraining
    zambia.build_campaign(campaign)

    laprep = ControlledVaccine(campaign,
                               waning_config=MapPiecewise(
                                   days=[0, 180, 210, 240, 270, 300, 330],
                                   effects=[0.8, 0.8, 0.7, 0.5, 0.3, 0.1, 0.0]),
                               common_intervention_parameters=CIP(intervention_name="LA-PrEP"))

    ip_restrictions = PropertyRestrictions(
        individual_property_restrictions=[["Accessibility: Yes", "Risk: HIGH"],
                                          ["Accessibility: Yes", "Risk: MEDIUM"]])

    laprep_coverages = [0.1, 0.3, 0.5, 0.5, 0.5, 0.7, 0.7, 0.7, 0.8, 0.8, 0.8, 0.8, 0.9, 0.9, 0.9]
    start_year = 2025
    for coverage in laprep_coverages:
        start_day = (start_year - 1960.5) * 365
        add_intervention_scheduled(campaign, start_day=start_day,
                                   target_demographics_config=TDC(demographic_coverage=coverage),
                                   property_restrictions=ip_restrictions,
                                   intervention_list=[laprep])
        start_year += 1

    return campaign
The ip_restrictions target only people who have access to healthcare (Accessibility: Yes)
and are at high or medium risk. This property must exist in the demographics — which is what
build_demographics sets up.
Modifying demographics
This build_demographics calls the Zambia baseline and then raises the proportion of the
population with access to healthcare to 90%:
def build_demographics():
    zambia = cm.ZambiaForTraining
    demographics = zambia.build_demographics()

    demographics.AddIndividualPropertyAndHINT(
        Property="Accessibility",
        Values=["Yes", "No"],
        InitialDistribution=[0.9, 0.1],
        overwrite_existing=True)
    return demographics
Using custom build functions
The custom functions are passed to EMODTask.from_defaults() in place of the country
model's built-in ones:
task = emod_task.EMODTask.from_defaults(
    eradication_path=manifest.eradication_path,
    schema_path=manifest.schema_file,
    config_builder=build_config,
    campaign_builder=build_campaign,
    demographics_builder=build_demographics,
    report_builder=add_reports)
The rest of the script — sweeping Run_Number, running the experiment, downloading results,
and plotting — is the same as Tutorial 2. Results are saved to tutorial_3_results/.
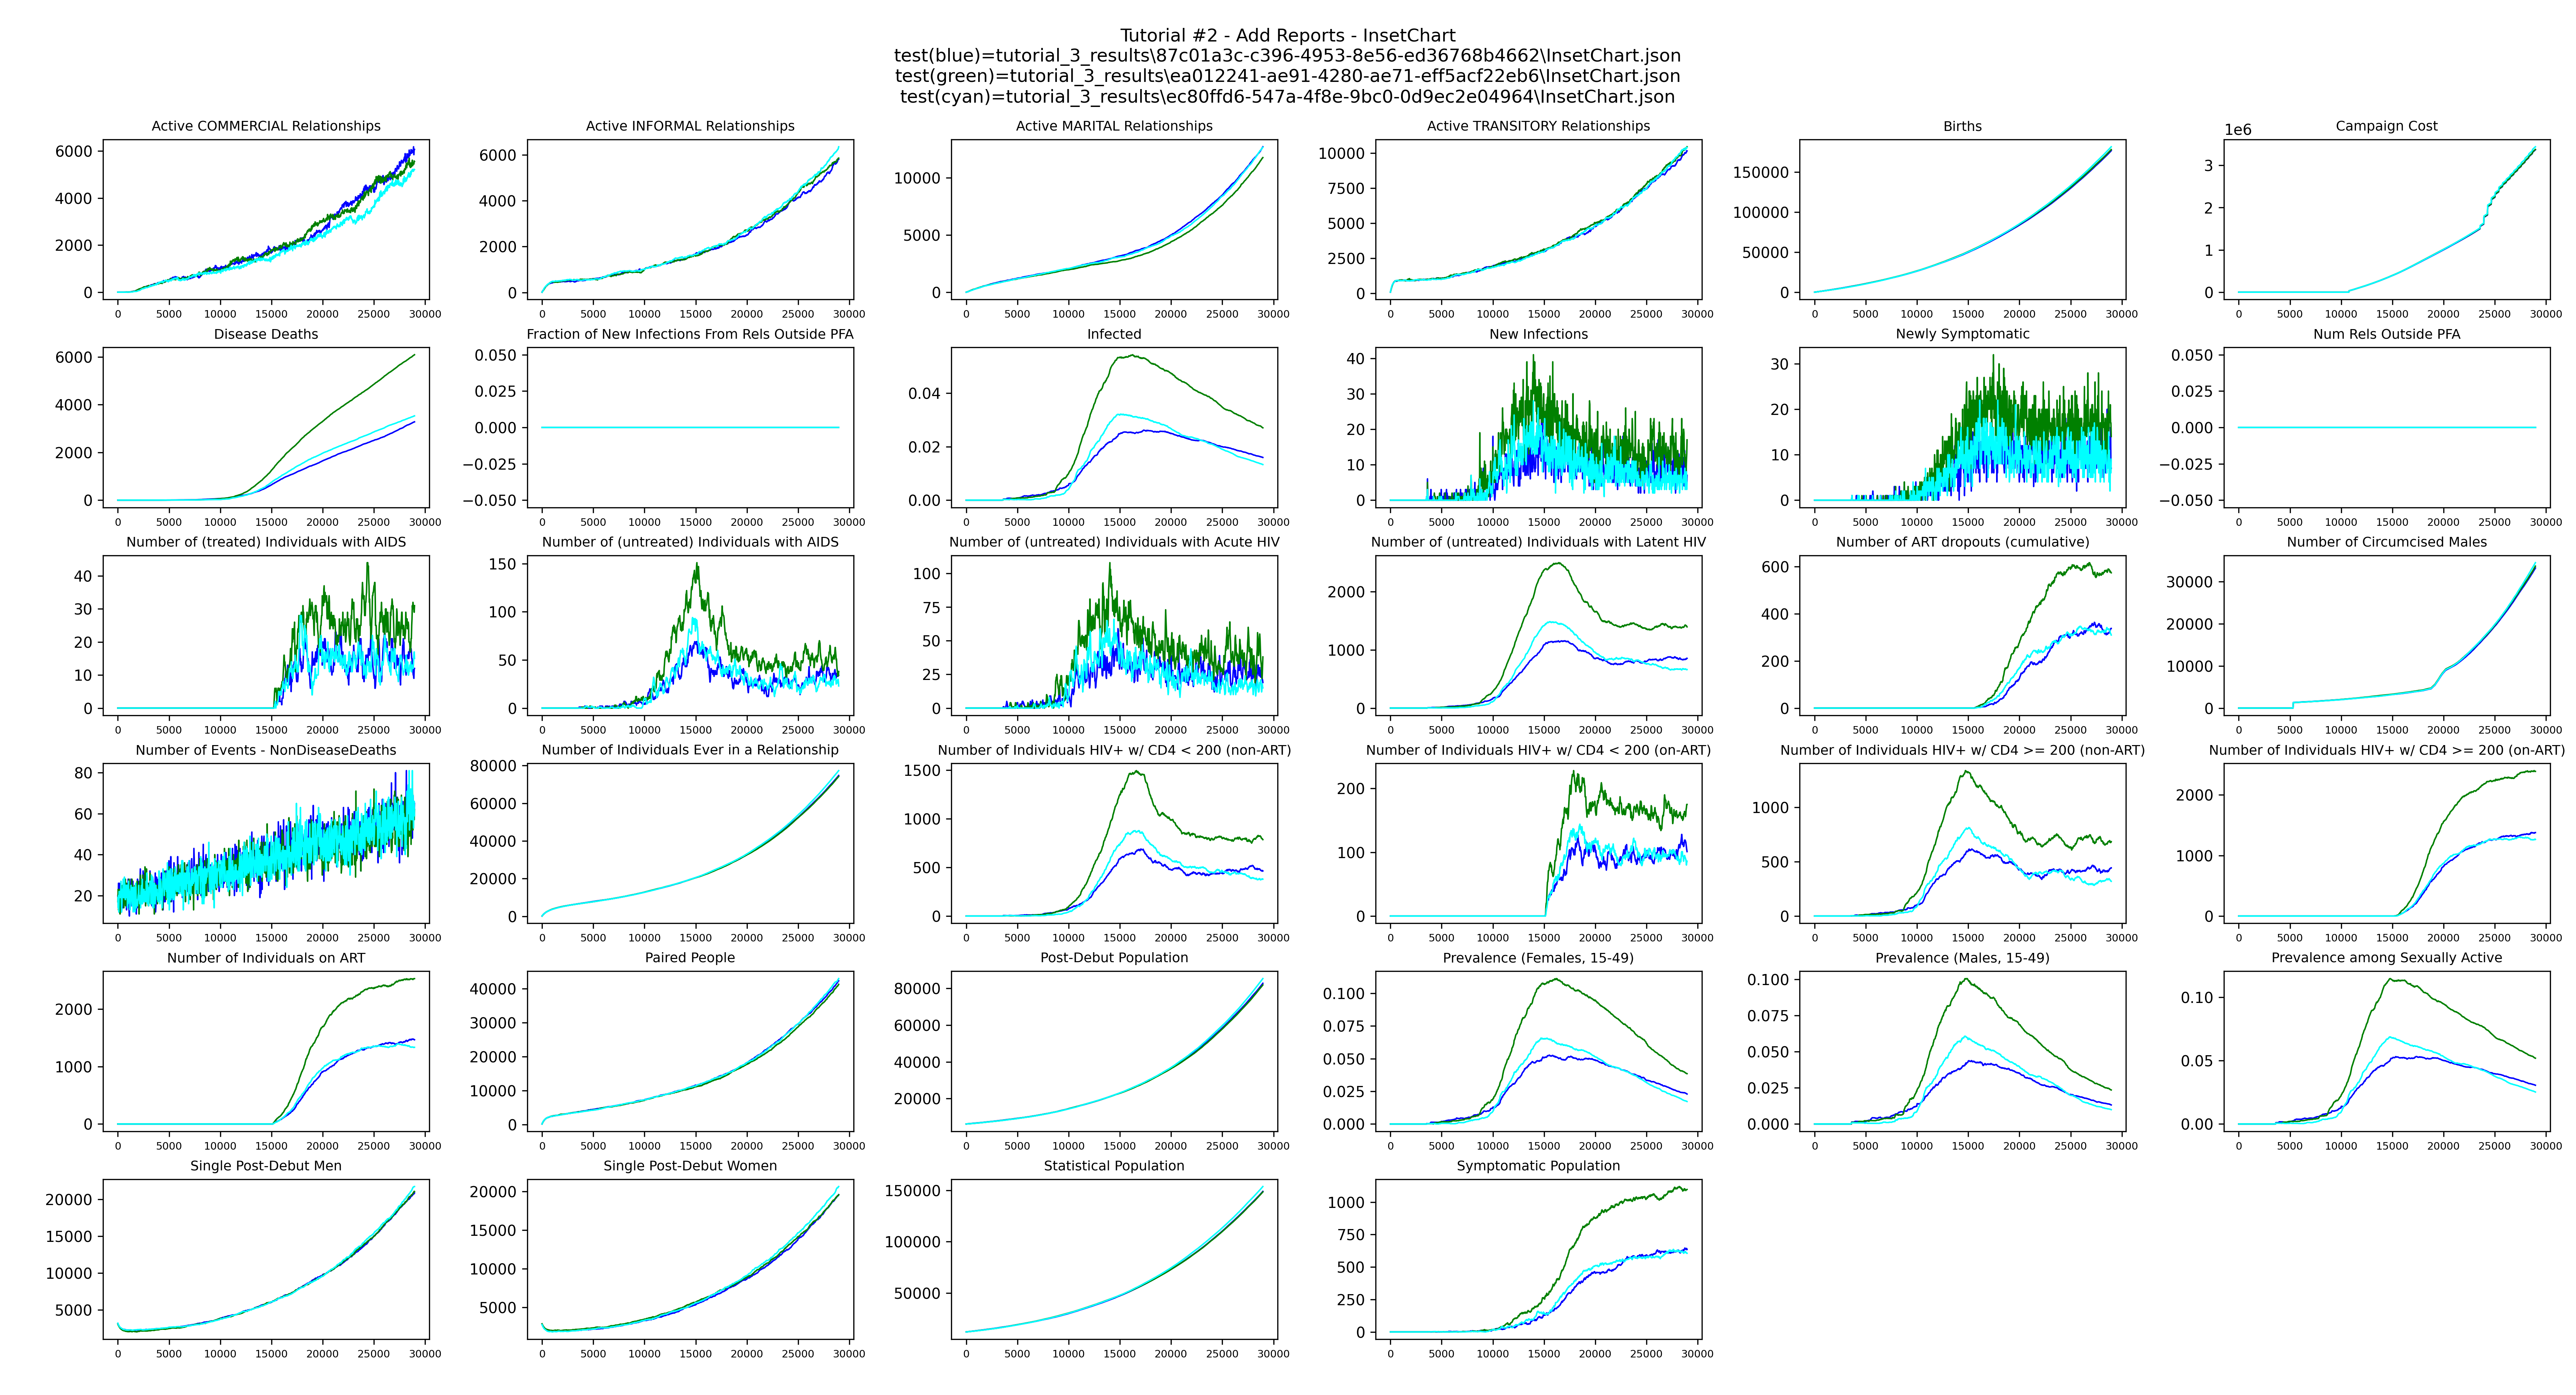
plot_inset_chart produces a grid of all channels from the InsetChart.json of each run,
with one line per realization, giving a quick overview of the simulation over time:
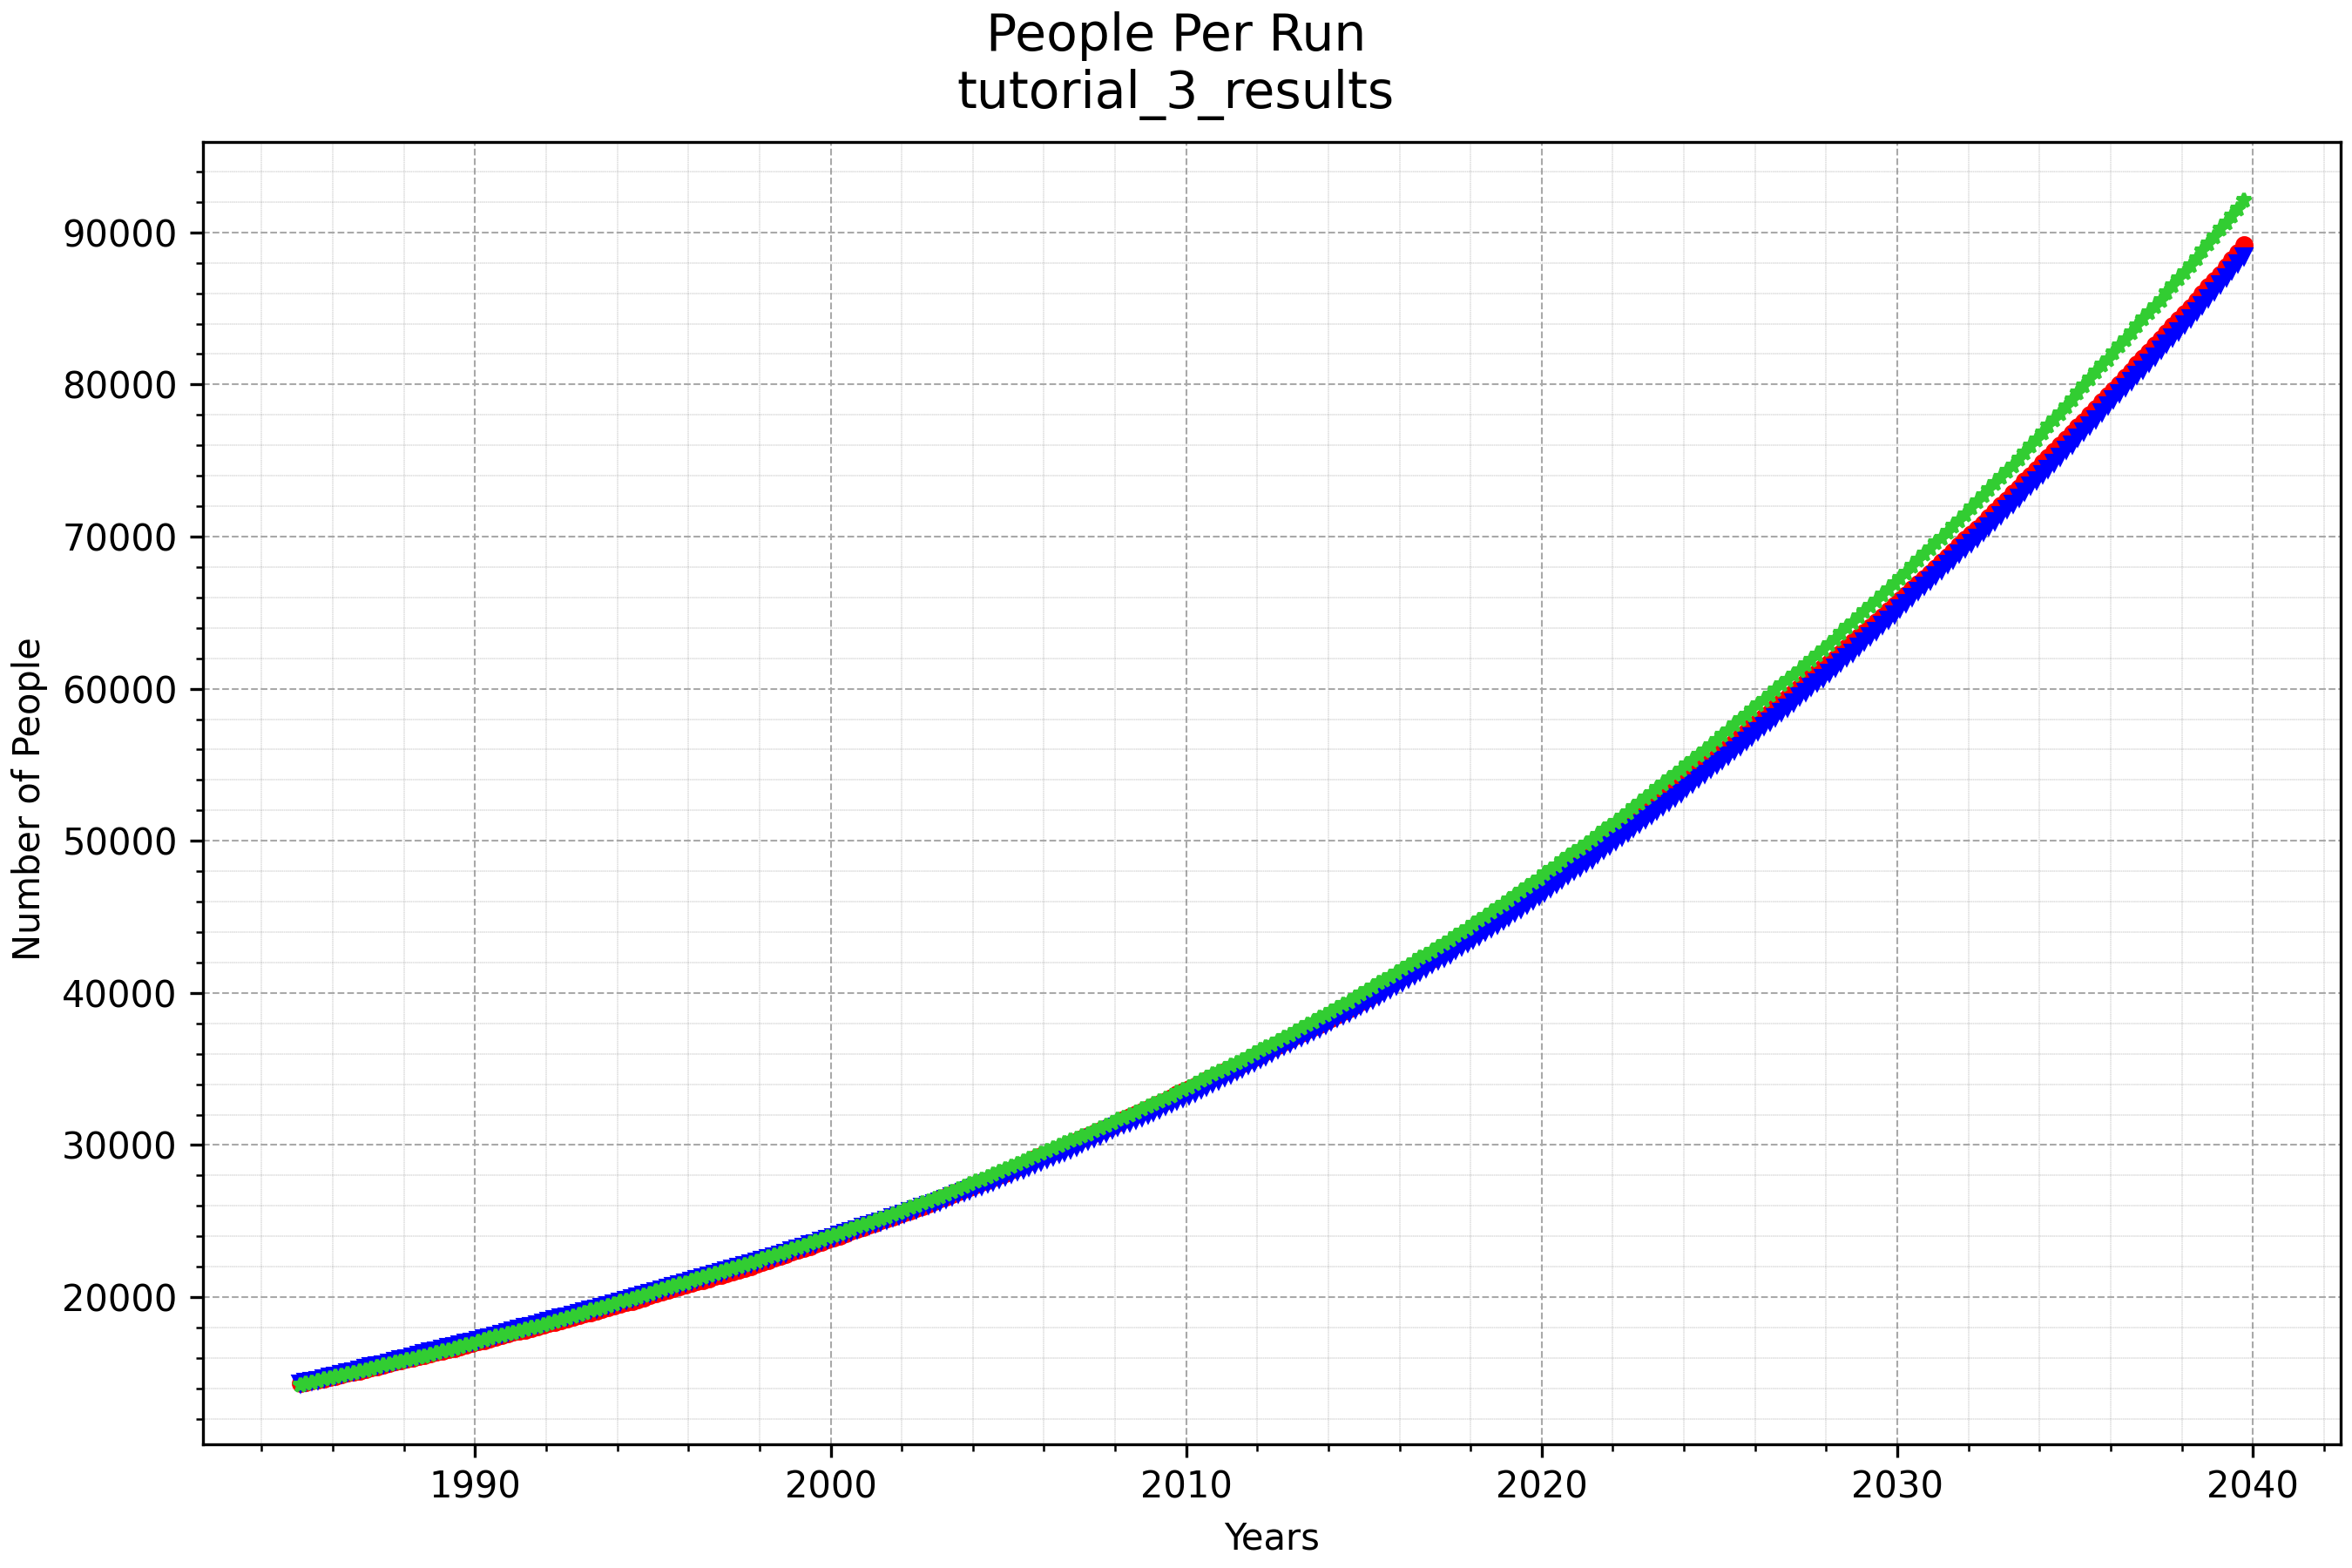
plot_population_by_age shows the population over time for each run:
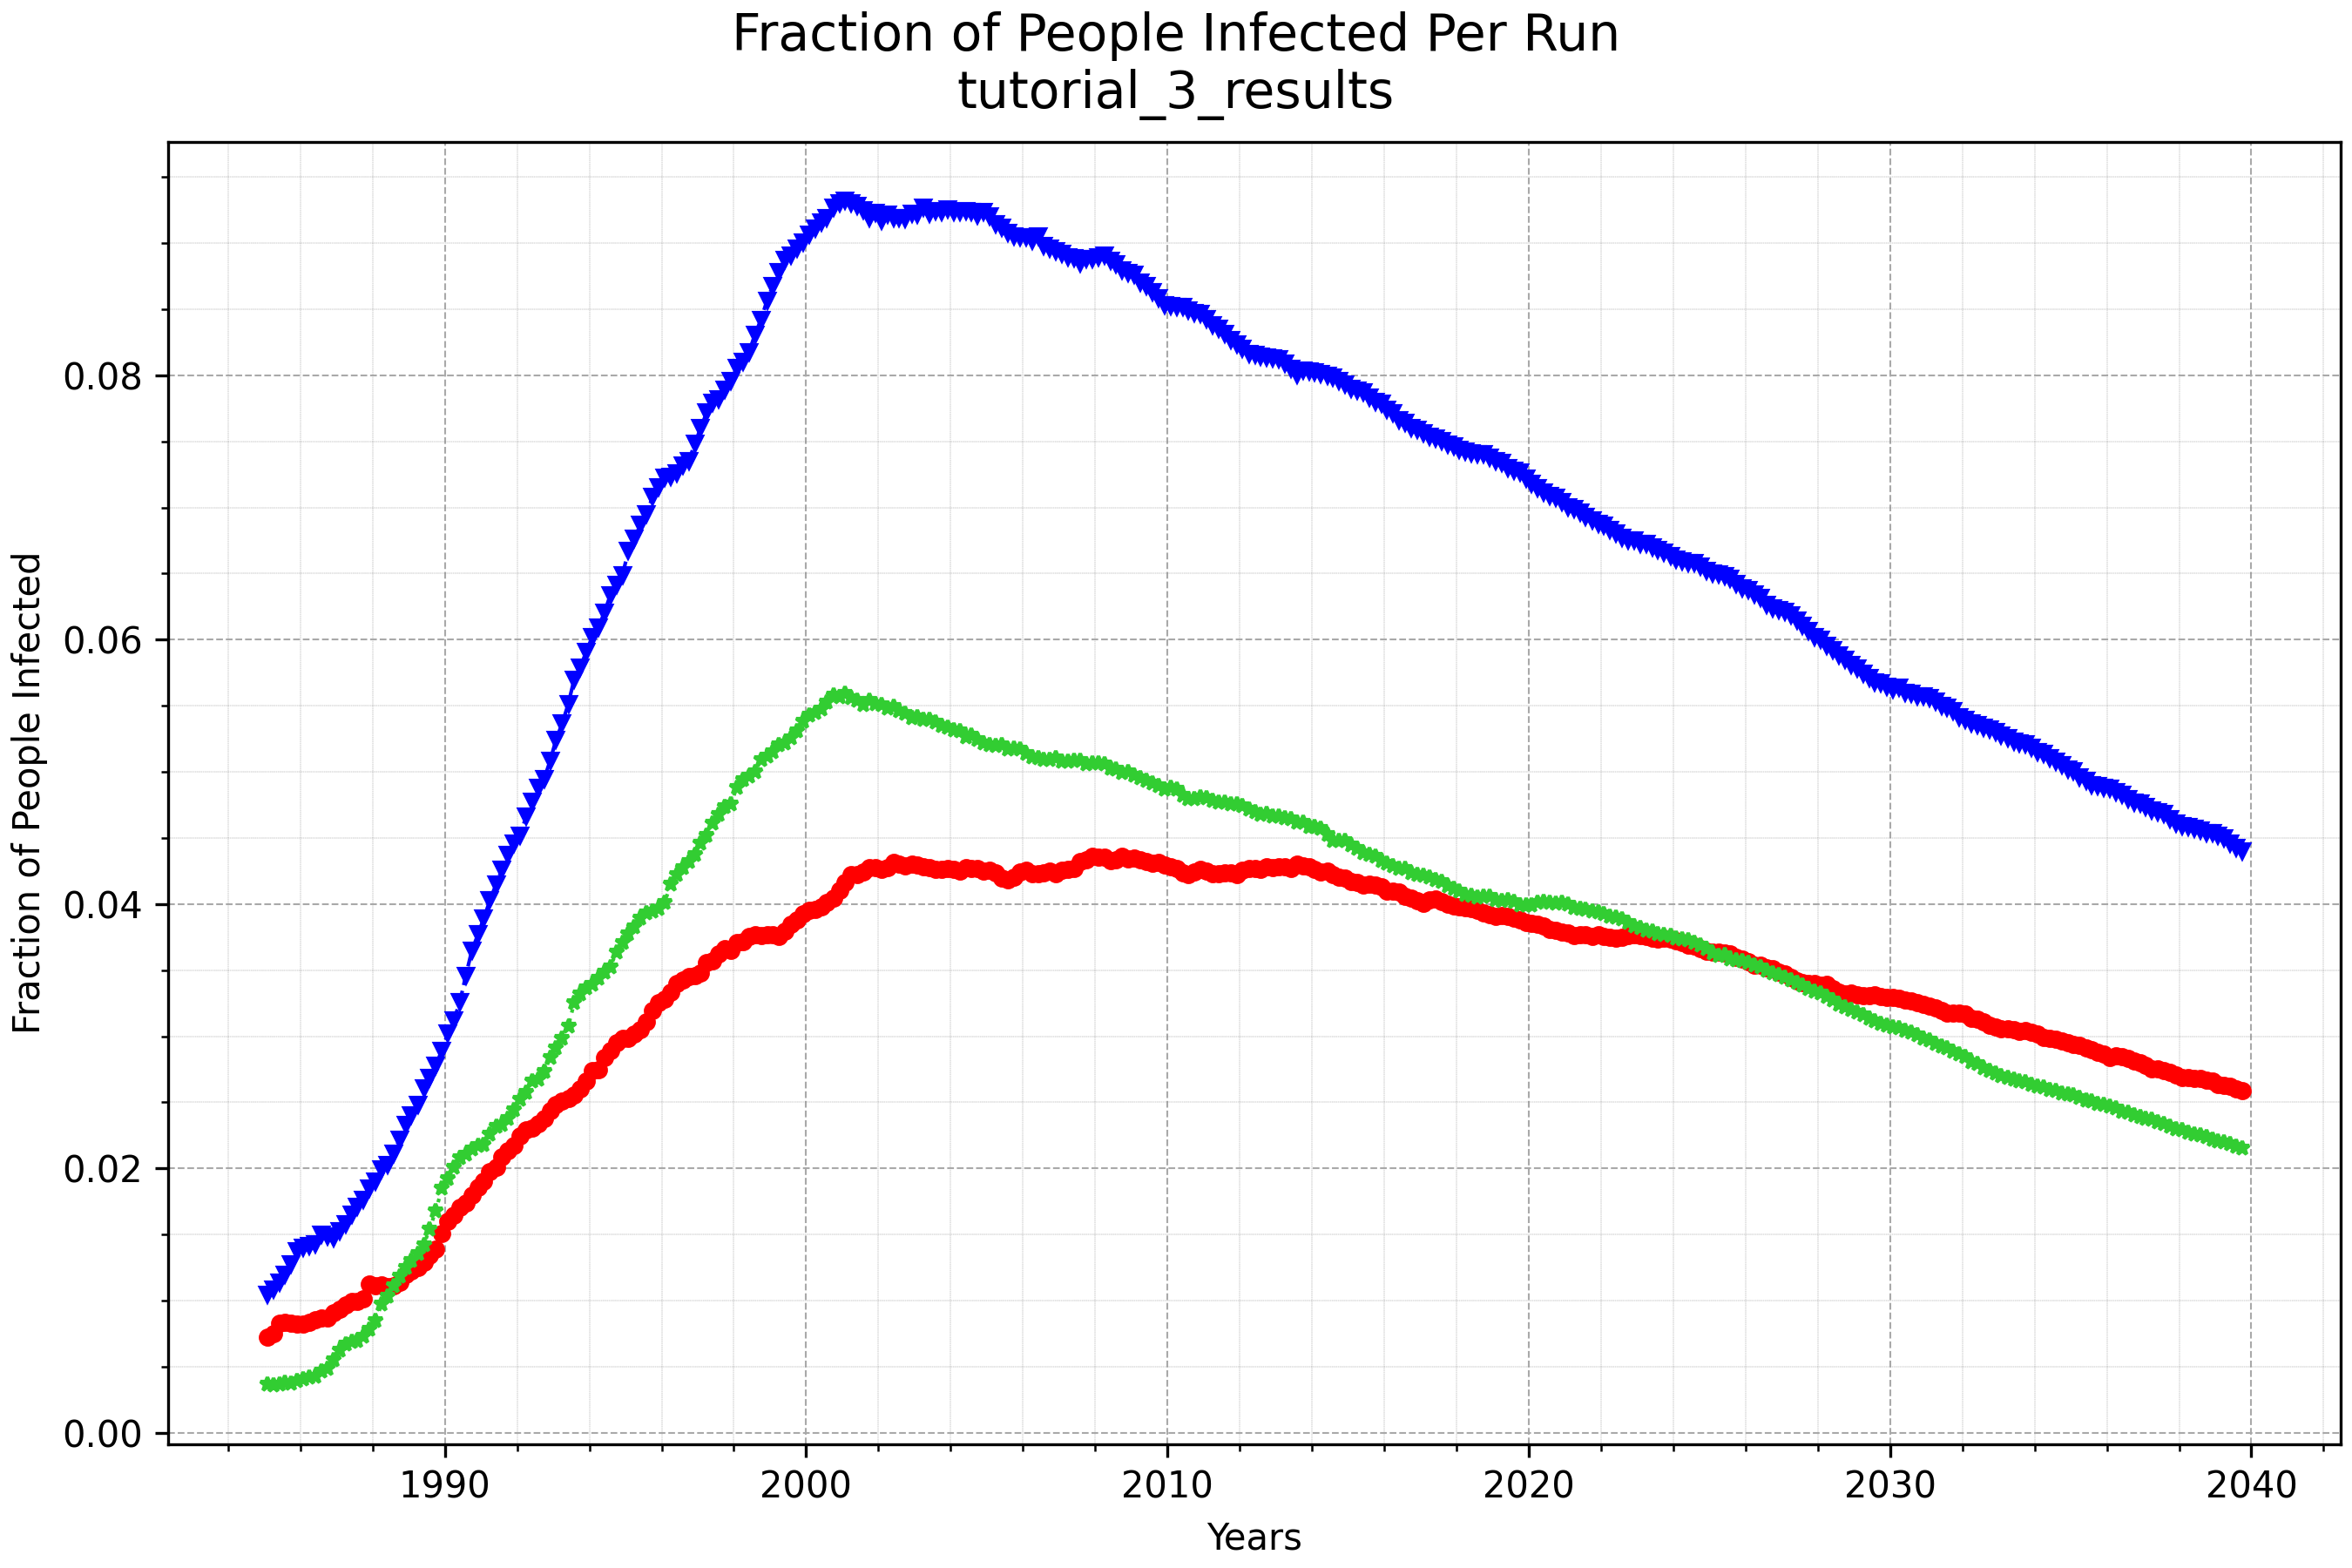
plot_prevalence_for_dir shows the fraction of the population infected with HIV over time
for each run:
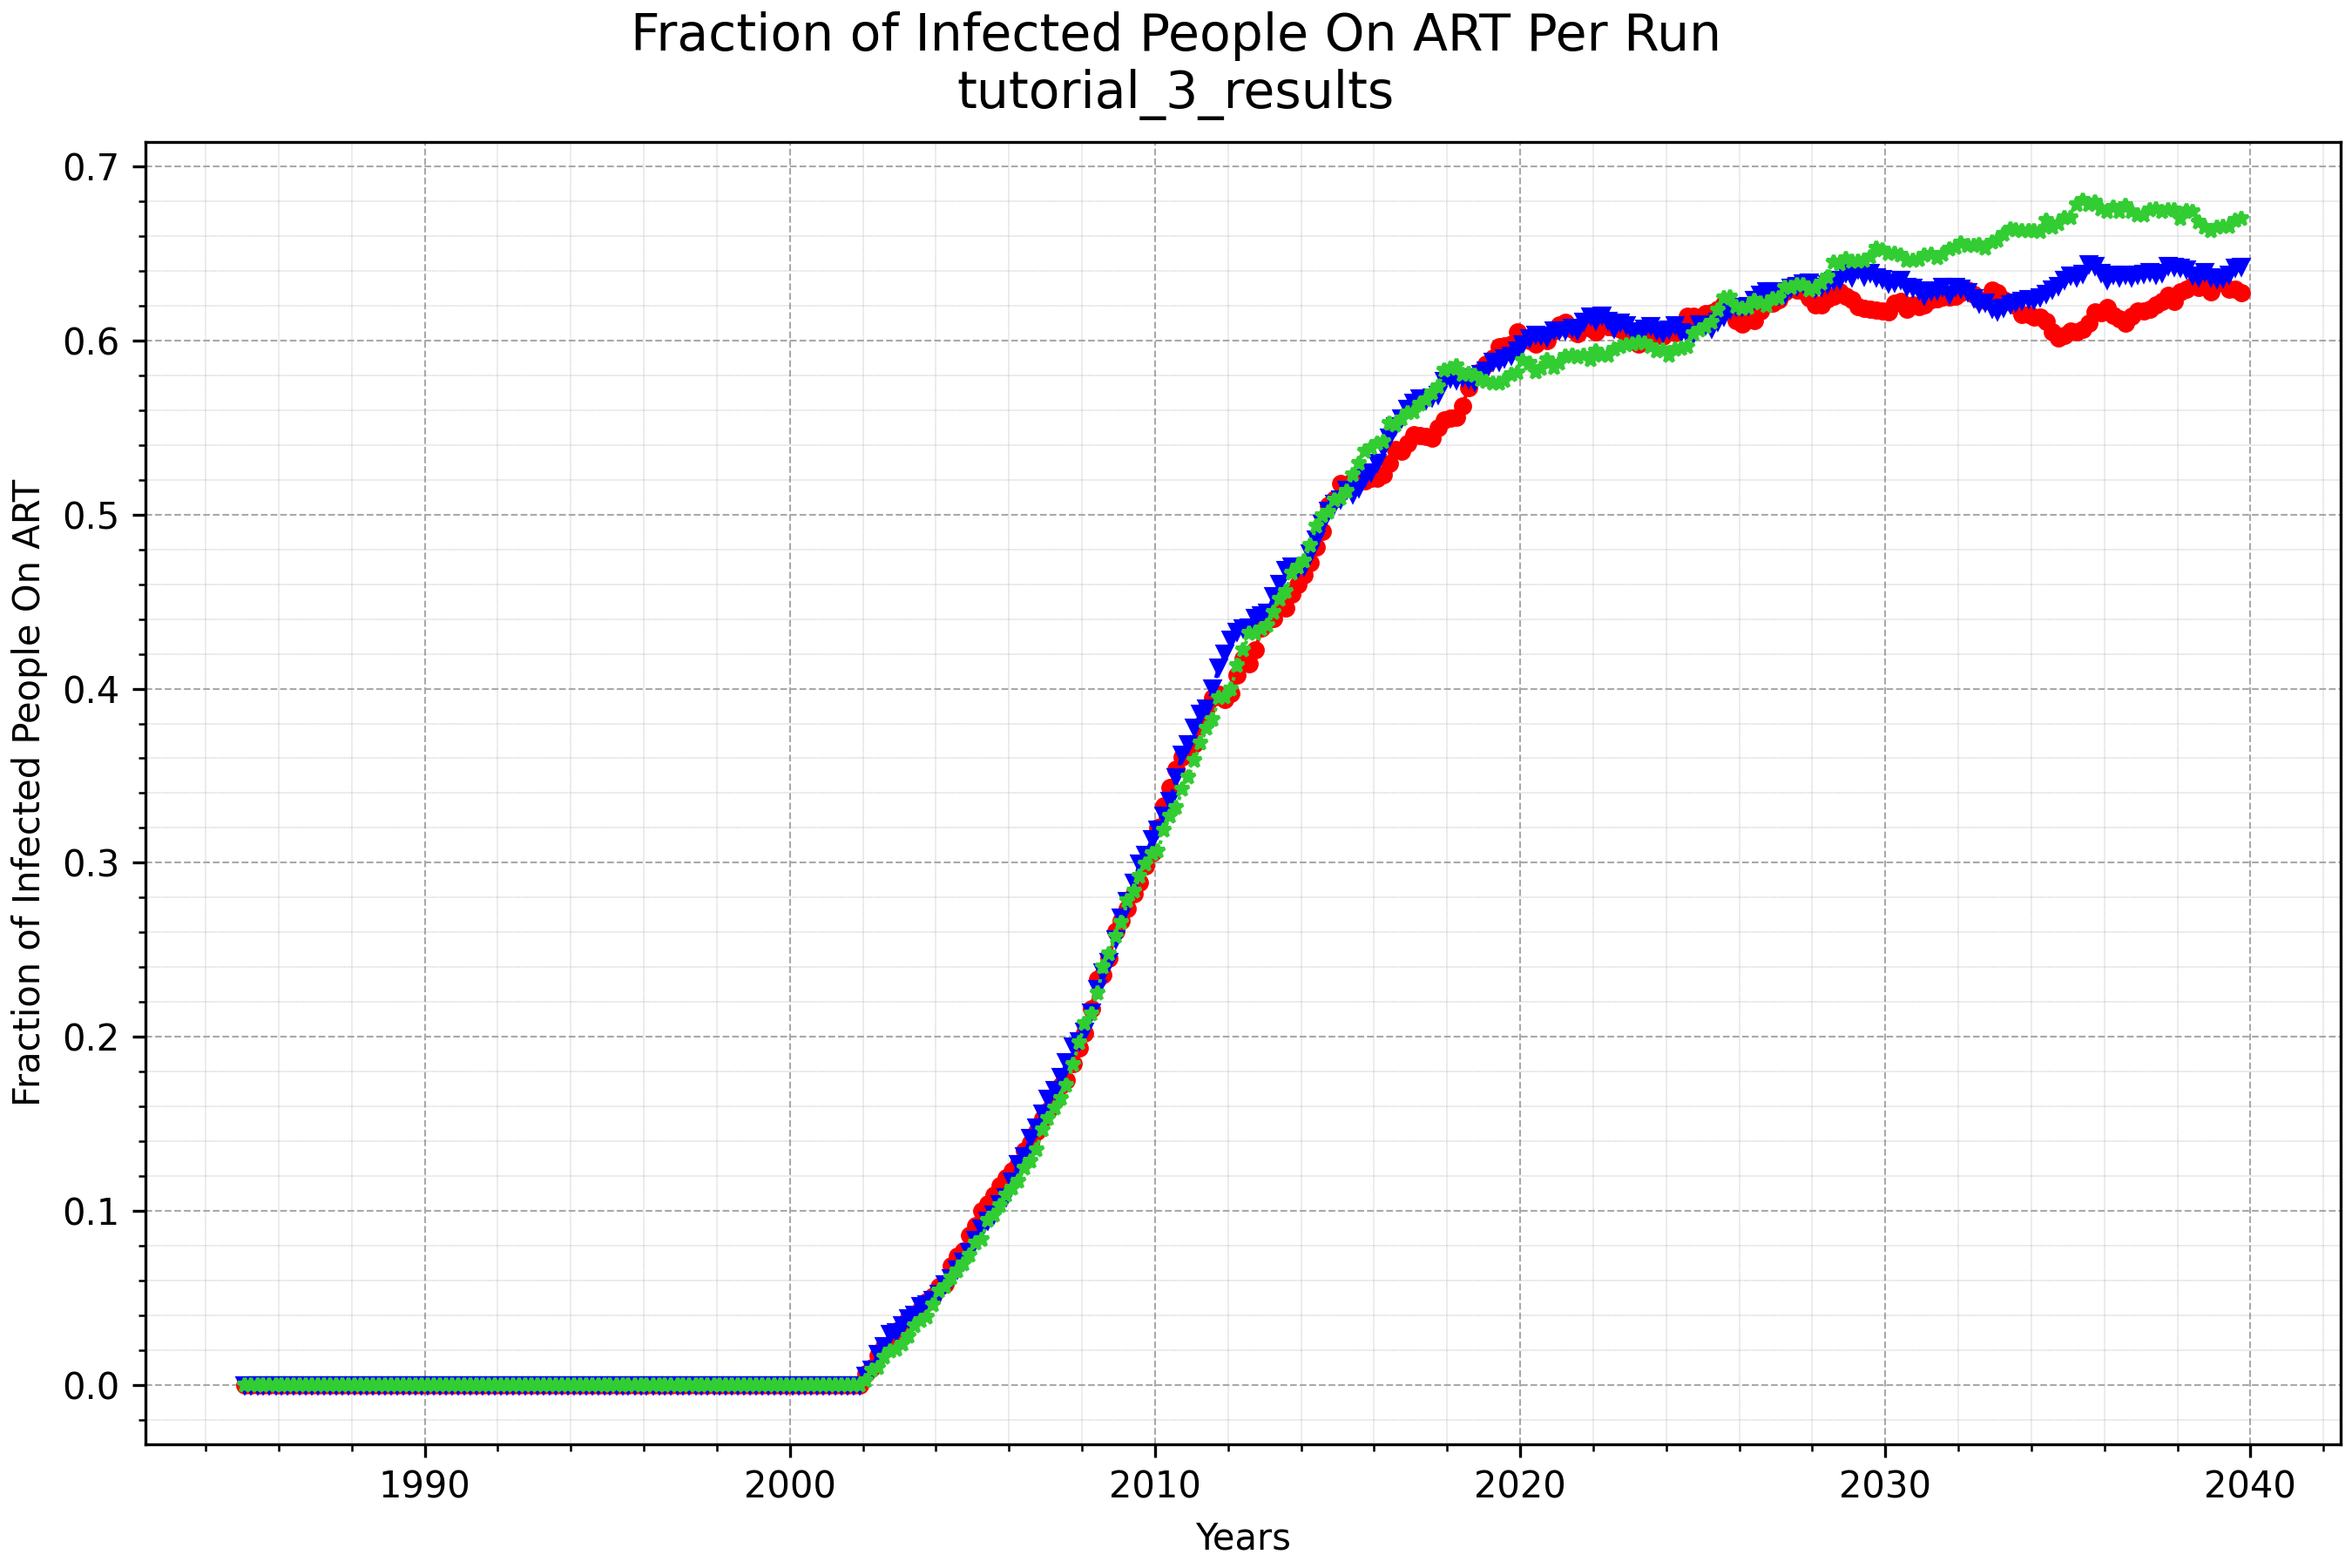
plot_onART_by_age shows the fraction of infected people on ART over time for each run: