Output reports
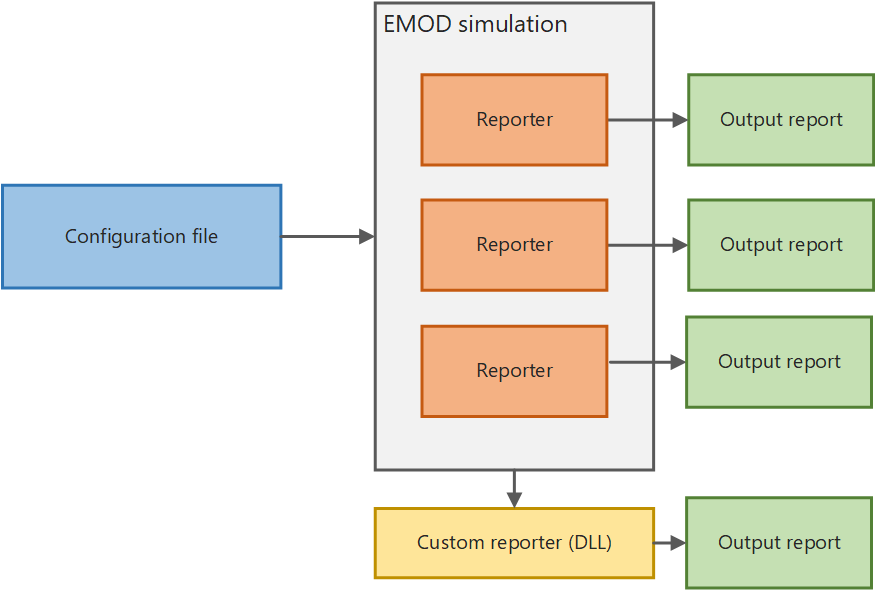
After running a simulation, the simulation data is extracted, aggregated, and saved as an output report to the output directory in the working directory. Depending on your configuration, one or more output reports will be created, each of which summarize different data from the simulation. Output reports can be in JSON, CSV, or binary file formats. EMOD also creates logging or error output files.
EMOD provides several built-in reporters for outputting data from simulations. By default, EMOD will always generate the report InsetChart.json, which contains the simulation-wide average disease prevalence by time step. If none of the provided reports generates the output report that you require, you can create a custom reporter. For more information, see the Advancing EMOD documentation.
If you want to visualize the data output from an EMOD simulation, you must use graphing software to plot the output reports. In addition to output reports, EMOD will generate error and logging files to help troubleshoot any issues you may encounter.
Using output reports
InsetChart.json, for example, contains per-time step values accumulated over the simulation in a variety of reporting channels, such as new infections, prevalence, and recovered. EMOD provides several other built-in reports that you can enable in the configuration file using the Output configuration parameters. Reports are generally in JSON or CSV format.
In order to interpret the output of EMOD simulations, you will find it useful to parse the output reports into an analyzable structure. For example, you can use a Python or R script to create graphs and charts for analysis.
For a full reference of available reports, see Reports reference.
Use Python to plot data
The example below uses the Python package json to parse the file and the Python package
matplotlib.pyplot to plot the output. This is a very simple example and not likely the most robust
or elegant. Be sure to set the actual path to your working directory.
import os
import json
import matplotlib.pyplot as plt

# open and parse InsetChart.json
ic_json = json.loads( open( os.path.join( WorkingDirectoryLocation, "output", "InsetChart.json" ) ).read() )
ic_json_allchannels = ic_json["Channels"]
ic_json_birthdata = ic_json["Channels"]["Births"]

# plot "Births" channel by time step
plt.plot( ic_json_birthdata[  "Data"  ], 'b-' )
plt.title( "Births" )
plt.show()