Plot simulation output
emodpy-hiv includes several scripts for plotting simulation output directly from the command line.
Each script accepts a file or directory of output files and produces one or more plots, either
displayed interactively or saved to an output directory. Run any script with --help to see the
full list of options.
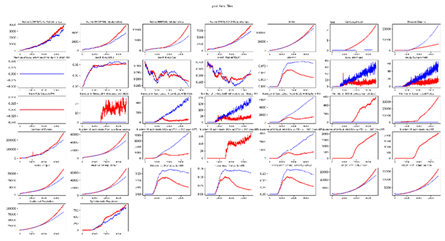
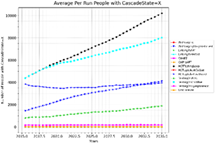
plot_inset_chart
Plots all channels from one or more InsetChart.json files as a grid of subplots. Up to three comparison files can be overlaid against a reference.
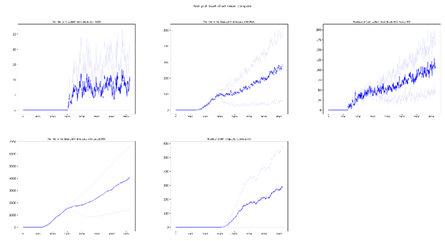
plot_inset_chart_mean_compare
Compares the mean of InsetChart.json files of up to three directories. Each directory can contain multiple InsetChart.json files from individual runs, like an experiment directory; the script calculates and plots the mean for each directory, allowing you to compare results between different scenarios or parameter sets.
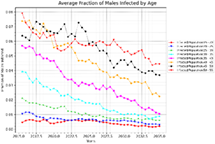
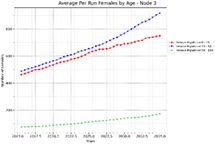
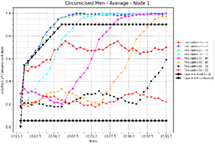
plot_hiv_by_age_and_gender
Plots data from ReportHIVByAgeAndGender.csv. Use the -p option
to select what to plot — options include population, prevalence, risk, vmmc, art,
state, column, and summary.
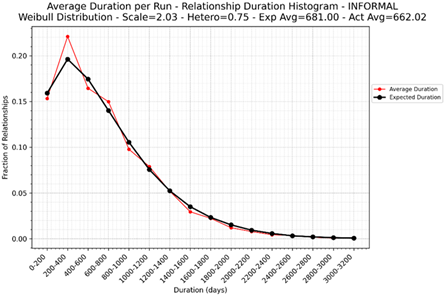
plot_relationship_end
Plots relationship duration histograms from RelationshipEnd.csv, with an option to overlay the expected Weibull distribution.
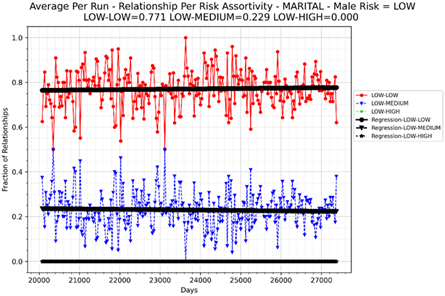
plot_relationship_start
Plots relationship assortivity by risk group from RelationshipStart.csv.
Additional plotting utilities
Additional Python utilities are available for more advanced use, including converting channel reports to DataFrames, generic x/y plotting, and file discovery across experiment directories. See the API reference for full details.